
- Start >
- Rivers >
- Discharge >
- Untere Donau >
- Köfering >
- Chart of year

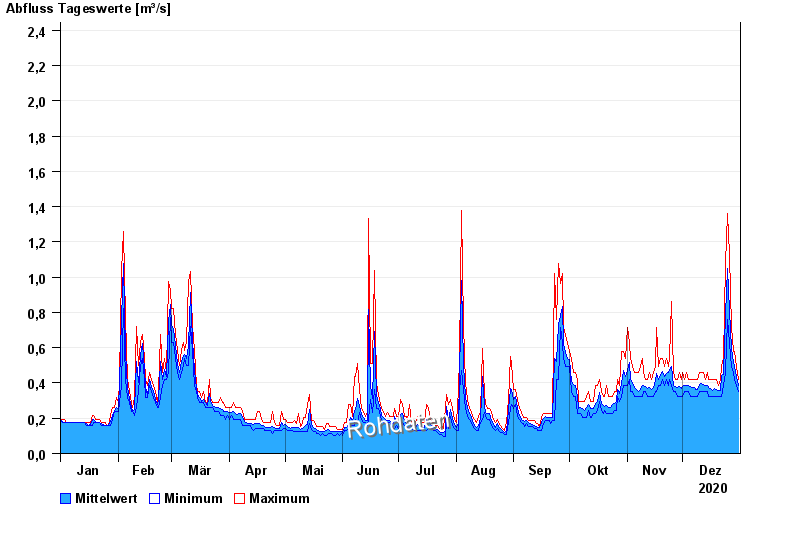
Chart of year Köfering / Pfatter
Discharge from 01.01.2020 to 31.12.2020
- 14.01.2011 Abfluss: 16,8 m³/s
- 02.03.1987 Abfluss: 12,1 m³/s
- 09.03.2006 Abfluss: 10,8 m³/s
- 16.03.1988 Abfluss: 10,5 m³/s
- 21.12.1993 Abfluss: 10,3 m³/s
| Date | Mean value [m³/s] | Maximum [m³/s] | Minimum [m³/s] |
|---|---|---|---|
| 31.12.2020 | 0.387 | 0.421 | 0.353 |
| 30.12.2020 | 0.435 | 0.496 | 0.386 |
| 29.12.2020 | 0.492 | 0.579 | 0.421 |
| 28.12.2020 | 0.518 | 0.579 | 0.458 |
| 27.12.2020 | 0.596 | 0.714 | 0.496 |
| 26.12.2020 | 0.813 | 1.13 | 0.623 |
| 25.12.2020 | 1.05 | 1.36 | 0.762 |
© Bayerisches Landesamt für Umwelt 2024