
- Start >
- Rivers >
- Discharge >
- Untere Donau >
- Köfering >
- Chart of year

Chart of year Köfering / Pfatter
Discharge from 02.12.2022 to 01.12.2023
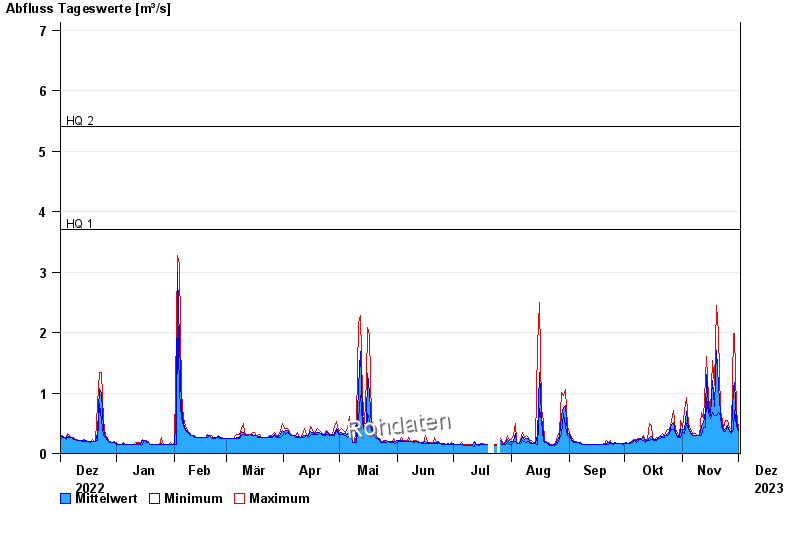
- HQ1 3,7 m³/s
- HQ2 5,4 m³/s
- HQ5 7,9 m³/s
- HQ10 10,1 m³/s
- HQ20 12,4 m³/s
- HQ50 15,9 m³/s
- HQ100 18,9 m³/s
| Date | Mean value [m³/s] | Maximum [m³/s] | Minimum [m³/s] |
|---|---|---|---|
| 01.12.2023 | 0.376 | 0.406 | 0.372 |
| 30.11.2023 | 0.539 | 0.719 | 0.461 |
| 29.11.2023 | 1.18 | 1.98 | 0.719 |
| 28.11.2023 | 1.08 | 1.98 | 0.389 |
| 27.11.2023 | 0.343 | 0.389 | 0.326 |
| 26.11.2023 | 0.386 | 0.424 | 0.356 |
| 25.11.2023 | 0.469 | 0.541 | 0.424 |
© Bayerisches Landesamt für Umwelt 2024