
- Start >
- Rivers >
- Discharge >
- Untere Donau >
- Kirchberg >
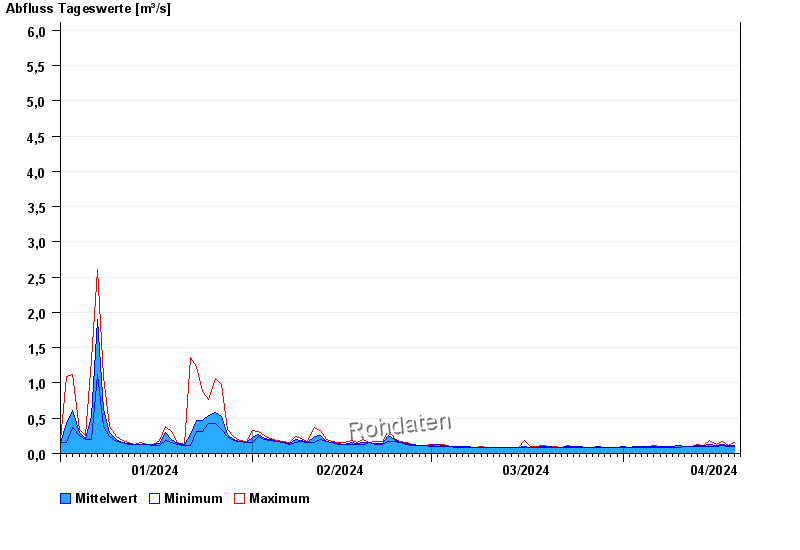
- Chart of year

Chart of year Kirchberg / Mertseebach
Discharge from 01.01.2024 to 19.04.2024
- HQ1 8 m³/s
- HQ2 11 m³/s
- HQ5 14 m³/s
- HQ10 18 m³/s
- HQ20 22 m³/s
- HQ50 28 m³/s
- HQ100 33 m³/s
| Date | Mean value [m³/s] | Maximum [m³/s] | Minimum [m³/s] |
|---|---|---|---|
| 19.04.2024 | 0.107 | 0.119 | 0.106 |
| 18.04.2024 | 0.118 | 0.119 | 0.106 |
| 17.04.2024 | 0.131 | 0.166 | 0.119 |
| 16.04.2024 | 0.116 | 0.134 | 0.106 |
| 15.04.2024 | 0.133 | 0.182 | 0.106 |
| 14.04.2024 | 0.109 | 0.119 | 0.106 |
| 13.04.2024 | 0.111 | 0.134 | 0.106 |
© Bayerisches Landesamt für Umwelt 2024