
- Start >
- Rivers >
- Discharge >
- Untere Donau >
- Kienhof >
- Chart of total period

Chart of total period Kienhof / Regen
Discharge from 01.11.1958 to 25.04.2024
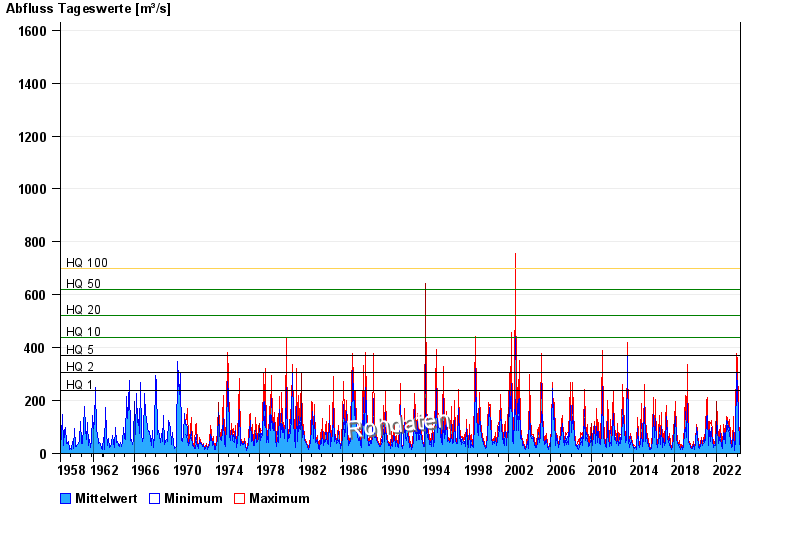
- HQ1 240 m³/s
- HQ2 305 m³/s
- HQ5 370 m³/s
- HQ10 440 m³/s
- HQ20 520 m³/s
- HQ50 620 m³/s
- HQ100 700 m³/s
| Date | Mean value [m³/s] | Maximum [m³/s] | Minimum [m³/s] |
|---|---|---|---|
| 25.04.2024 | 30.7 | 31.2 | 30.4 |
| 24.04.2024 | 32.5 | 34.4 | 31.2 |
| 23.04.2024 | 38.6 | 43.9 | 34.4 |
| 22.04.2024 | 51.3 | 56.5 | 43.9 |
| 21.04.2024 | 73.2 | 88.3 | 55.5 |
| 20.04.2024 | 66.4 | 86.8 | 37.8 |
| 19.04.2024 | 40.3 | 43.9 | 36.9 |
© Bayerisches Landesamt für Umwelt 2024