
- Start >
- Rivers >
- Discharge >
- Untere Donau >
- Kempten >
- Chart of year

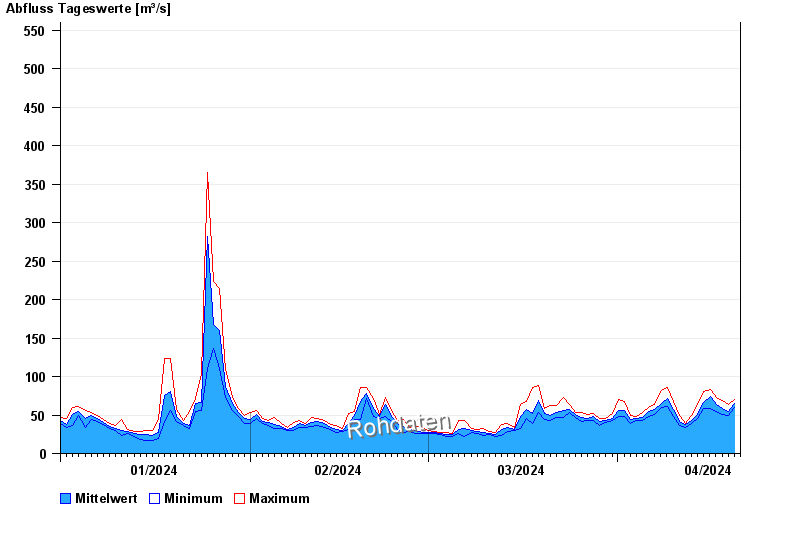
Chart of year Kempten / Iller
Discharge from 01.01.2024 to 20.04.2024
- 23.08.2005 Abfluss: 1040 m³/s
- 22.05.1999 Abfluss: 969 m³/s
- 15.06.1910 Abfluss: 750 m³/s
- 12.08.2002 Abfluss: 679 m³/s
- 02.06.2013 Abfluss: 650 m³/s
| Date | Mean value [m³/s] | Maximum [m³/s] | Minimum [m³/s] |
|---|---|---|---|
| 20.04.2024 | 67.6 | 70.4 | 62.3 |
| 19.04.2024 | 54.9 | 63.4 | 49.5 |
| 18.04.2024 | 58.3 | 68.3 | 51.2 |
| 17.04.2024 | 63.5 | 72.5 | 54.8 |
| 16.04.2024 | 74 | 83.3 | 58.5 |
| 15.04.2024 | 66 | 80 | 58.5 |
| 14.04.2024 | 51.2 | 63.4 | 45.2 |
© Bayerisches Landesamt für Umwelt 2024