
- Start >
- Rivers >
- Discharge >
- Untere Donau >
- Kempten >
- Chart of year

Chart of year Kempten / Iller
Discharge from 01.01.2024 to 23.04.2024
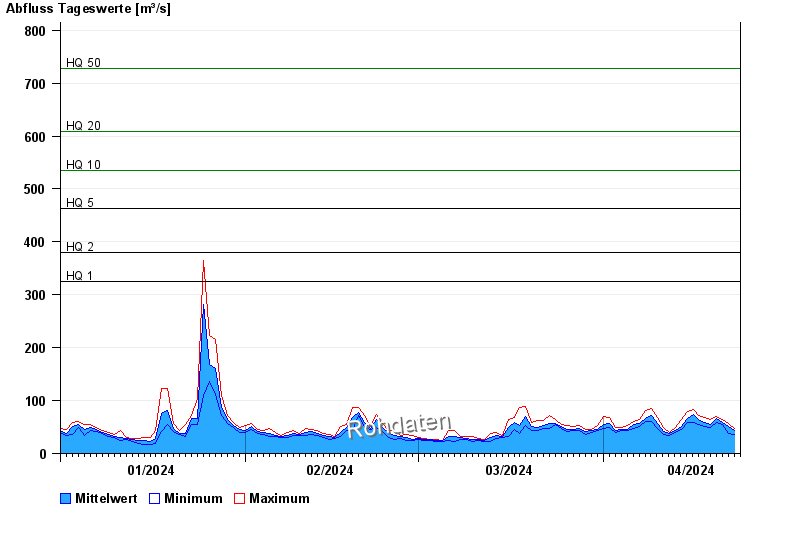
- HQ1 326 m³/s
- HQ2 379 m³/s
- HQ5 463 m³/s
- HQ10 534 m³/s
- HQ20 609 m³/s
- HQ50 728 m³/s
- HQ100 829 m³/s
| Date | Mean value [m³/s] | Maximum [m³/s] | Minimum [m³/s] |
|---|---|---|---|
| 23.04.2024 | 44.7 | 47.7 | 35 |
| 22.04.2024 | 50.2 | 57.6 | 38 |
| 21.04.2024 | 57.8 | 63.4 | 54.8 |
| 20.04.2024 | 65.5 | 70.4 | 59.5 |
| 19.04.2024 | 54.9 | 63.4 | 49.5 |
| 18.04.2024 | 58.3 | 68.3 | 51.2 |
| 17.04.2024 | 63.5 | 72.5 | 54.8 |
© Bayerisches Landesamt für Umwelt 2024