
- Start >
- Rivers >
- Discharge >
- Untere Donau >
- Kemmern >
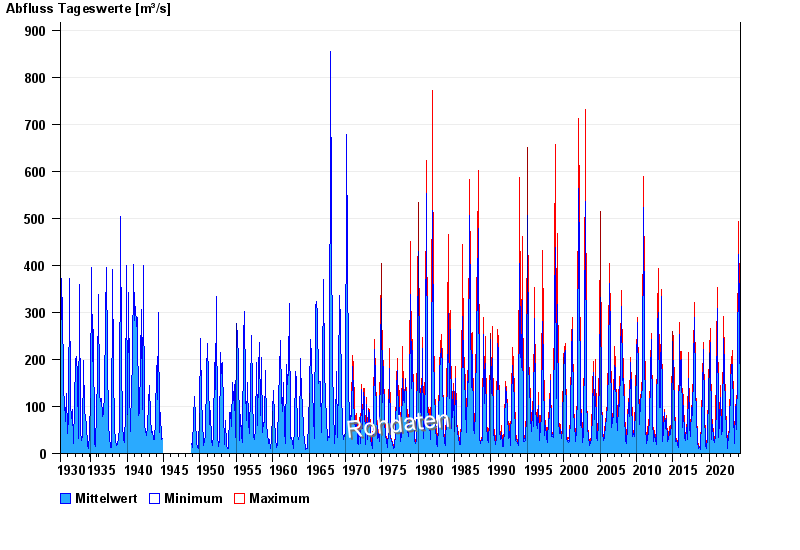
- Chart of total period

Chart of total period Kemmern / Main
Discharge from 01.11.1930 to 23.04.2024
| Date | Mean value [m³/s] | Maximum [m³/s] | Minimum [m³/s] |
|---|---|---|---|
| 23.04.2024 | 77.3 | 78.6 | 73.1 |
| 22.04.2024 | 77.7 | 78.6 | 76.1 |
| 21.04.2024 | 70 | 76.1 | 62.6 |
| 20.04.2024 | 53.5 | 62.6 | 40 |
| 19.04.2024 | 37.1 | 39.4 | 35.9 |
| 18.04.2024 | 38.7 | 39.4 | 37.7 |
| 17.04.2024 | 35.3 | 38.3 | 32.6 |
© Bayerisches Landesamt für Umwelt 2024