
- Start >
- Rivers >
- Discharge >
- Untere Donau >
- Kemmern >
- Chart of total period

Chart of total period Kemmern / Main
Discharge from 01.11.1930 to 26.04.2024
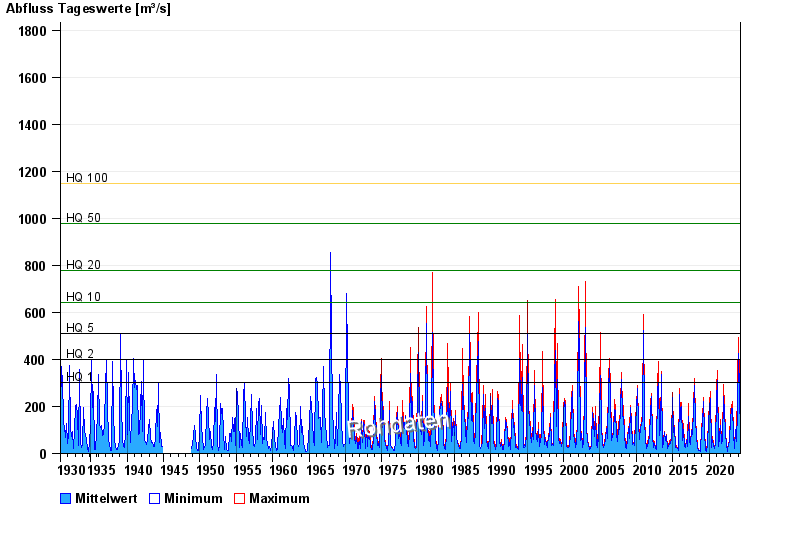
- HQ1 300 m³/s
- HQ2 400 m³/s
- HQ5 510 m³/s
- HQ10 640 m³/s
- HQ20 780 m³/s
- HQ50 980 m³/s
- HQ100 1150 m³/s
| Date | Mean value [m³/s] | Maximum [m³/s] | Minimum [m³/s] |
|---|---|---|---|
| 26.04.2024 | 59.1 | 59.1 | 59.1 |
| 25.04.2024 | 60.6 | 62.6 | 59.1 |
| 24.04.2024 | 67.7 | 73.1 | 63.4 |
| 23.04.2024 | 77.2 | 78.6 | 73.1 |
| 22.04.2024 | 77.7 | 78.6 | 76.1 |
| 21.04.2024 | 70 | 76.1 | 62.6 |
| 20.04.2024 | 53.5 | 62.6 | 40 |
© Bayerisches Landesamt für Umwelt 2024