
- Start >
- Rivers >
- Discharge >
- Untere Donau >
- Heitzenhofen >
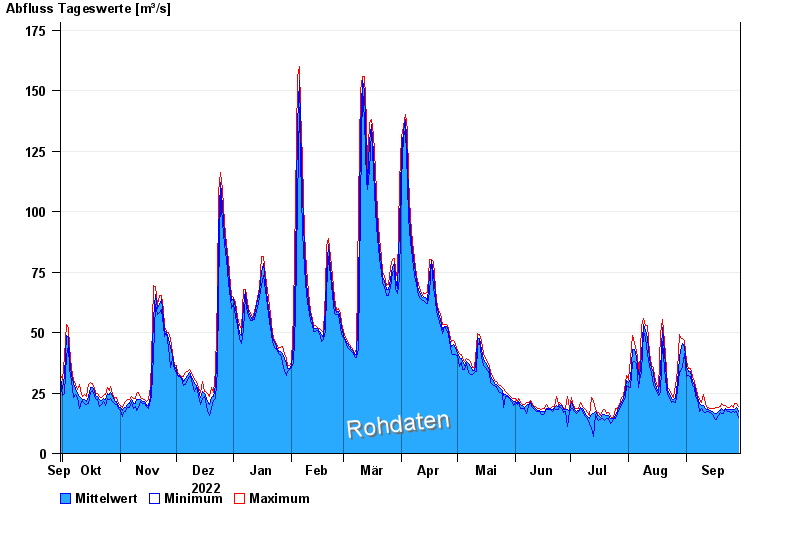
- Chart of year

Chart of year Heitzenhofen / Naab
Discharge from 30.09.2022 to 29.09.2023
| Date | Mean value [m³/s] | Maximum [m³/s] | Minimum [m³/s] |
|---|---|---|---|
| 29.09.2023 | 17.5 | 19.5 | 15 |
| 28.09.2023 | 19 | 20.8 | 17.2 |
| 27.09.2023 | 18.1 | 20.8 | 16.8 |
| 26.09.2023 | 18 | 19.1 | 17.2 |
| 25.09.2023 | 18.1 | 20 | 16.8 |
| 24.09.2023 | 18.1 | 19.1 | 17.2 |
| 23.09.2023 | 18 | 19.1 | 17.2 |
© Bayerisches Landesamt für Umwelt 2024