
- Start >
- Rivers >
- Discharge >
- Untere Donau >
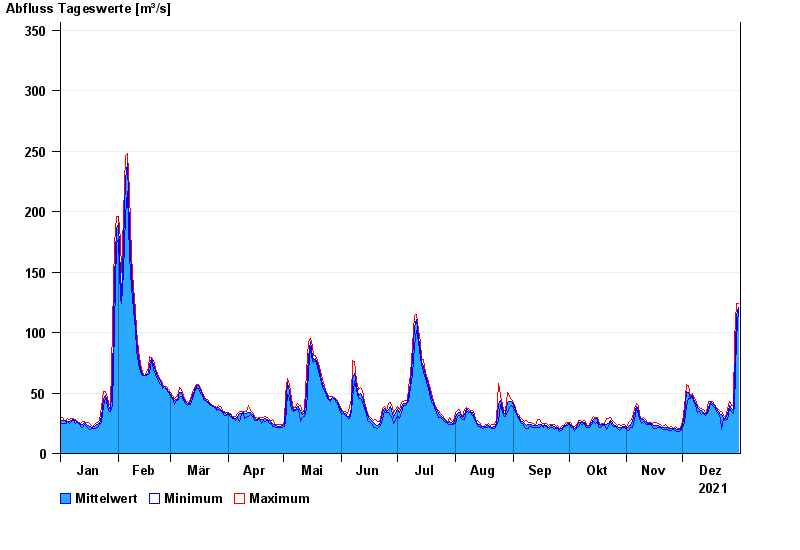
- Heitzenhofen >
- Chart of year

Chart of year Heitzenhofen / Naab
Discharge from 01.01.2021 to 31.12.2021
- 06.02.1909 Abfluss: 950 m³/s
- 30.12.1947 Abfluss: 765 m³/s
- 12.07.1954 Abfluss: 730 m³/s
- 16.01.2011 Abfluss: 715 m³/s
- 28.03.1988 Abfluss: 611 m³/s
| Date | Mean value [m³/s] | Maximum [m³/s] | Minimum [m³/s] |
|---|---|---|---|
| 31.12.2021 | 121 | 124 | 119 |
| 30.12.2021 | 114 | 124 | 94.9 |
| 29.12.2021 | 61.9 | 94.9 | 39.3 |
| 28.12.2021 | 35.9 | 39.3 | 32.7 |
| 27.12.2021 | 37.1 | 39.8 | 34.9 |
| 26.12.2021 | 39.5 | 42.7 | 37.6 |
| 25.12.2021 | 32.2 | 37.6 | 28.1 |
© Bayerisches Landesamt für Umwelt 2024