
- Start >
- Rivers >
- Discharge >
- Untere Donau >
- Heitzenhofen >
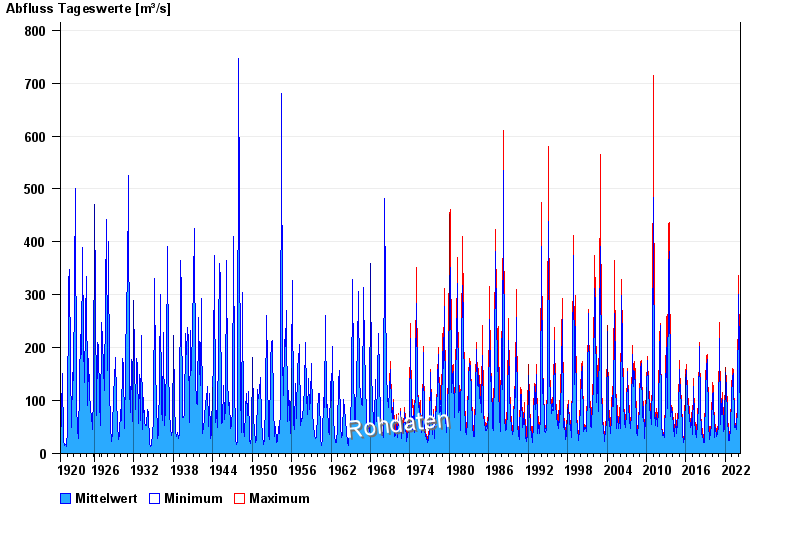
- Chart of total period

Chart of total period Heitzenhofen / Naab
Discharge from 01.11.1920 to 20.04.2024
| Date | Mean value [m³/s] | Maximum [m³/s] | Minimum [m³/s] |
|---|---|---|---|
| 20.04.2024 | 46.9 | 46.9 | 46.9 |
| 19.04.2024 | 45.1 | 46.9 | 44.5 |
| 18.04.2024 | 43.6 | 45.1 | 41.7 |
| 17.04.2024 | 36.7 | 41.7 | 34.5 |
| 16.04.2024 | 32.6 | 35 | 30.8 |
| 15.04.2024 | 30.5 | 31.3 | 29.2 |
| 14.04.2024 | 31.1 | 33.3 | 29.7 |
© Bayerisches Landesamt für Umwelt 2024