
- Start >
- Rivers >
- Discharge >
- Untere Donau >
- Hammermühle >
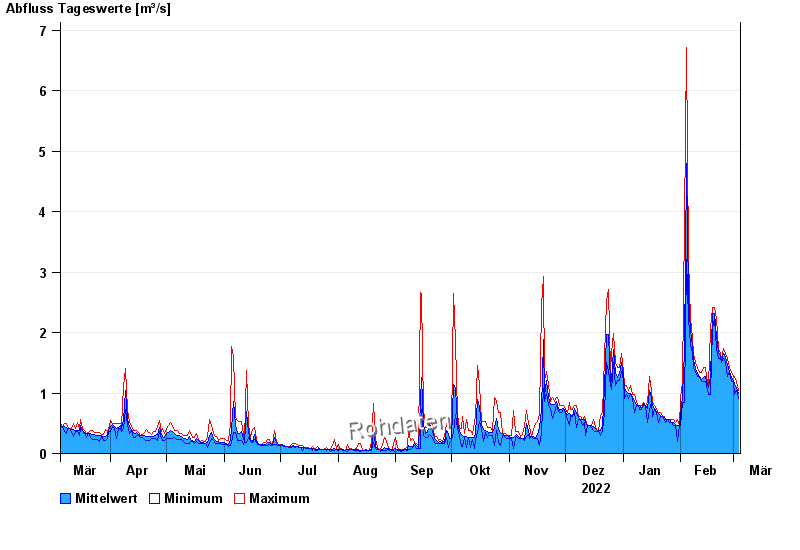
- Chart of year

Chart of year Hammermühle / Otterbach
Discharge from 05.03.2022 to 04.03.2023
| Date | Mean value [m³/s] | Maximum [m³/s] | Minimum [m³/s] |
|---|---|---|---|
| 04.03.2023 | 0.998 | 1.05 | 0.914 |
| 03.03.2023 | 1.09 | 1.19 | 1.05 |
| 02.03.2023 | 1.14 | 1.27 | 0.983 |
| 01.03.2023 | 1.2 | 1.27 | 1.19 |
| 28.02.2023 | 1.25 | 1.34 | 1.19 |
| 27.02.2023 | 1.36 | 1.42 | 1.34 |
| 26.02.2023 | 1.48 | 1.57 | 1.27 |
© Bayerisches Landesamt für Umwelt 2024