
- Start >
- Rivers >
- Discharge >
- Untere Donau >
- Hammermühle >
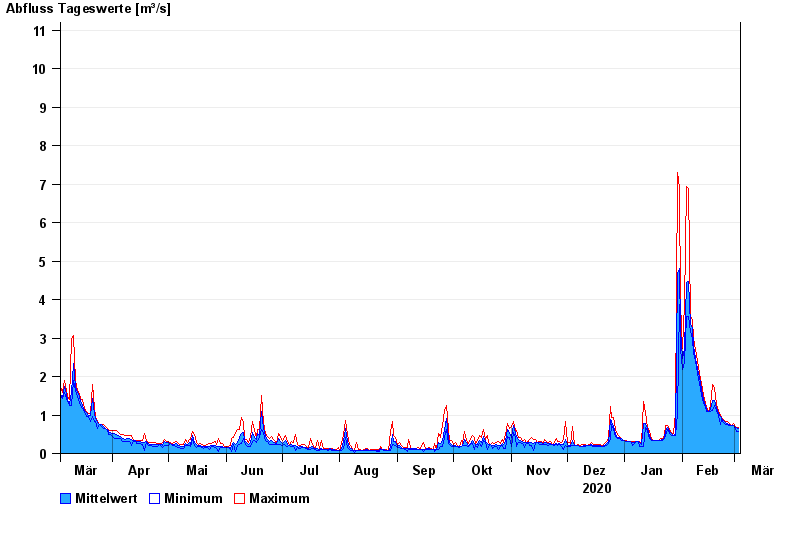
- Chart of year

Chart of year Hammermühle / Otterbach
Discharge from 04.03.2020 to 03.03.2021
- 31.05.2013 Abfluss: 32,1 m³/s
- 03.06.2013 Abfluss: 30,6 m³/s
- 21.12.1993 Abfluss: 29,7 m³/s
- 25.03.1988 Abfluss: 25,9 m³/s
- 02.02.1985 Abfluss: 24,1 m³/s
| Date | Mean value [m³/s] | Maximum [m³/s] | Minimum [m³/s] |
|---|---|---|---|
| 03.03.2021 | 0.654 | 0.687 | 0.575 |
| 02.03.2021 | 0.675 | 0.682 | 0.57 |
| 01.03.2021 | 0.692 | 0.73 | 0.673 |
| 28.02.2021 | 0.73 | 0.786 | 0.723 |
| 27.02.2021 | 0.721 | 0.723 | 0.718 |
| 26.02.2021 | 0.754 | 0.775 | 0.716 |
| 25.02.2021 | 0.769 | 0.826 | 0.765 |
© Bayerisches Landesamt für Umwelt 2024