
- Start >
- Rivers >
- Discharge >
- Untere Donau >
- Grafenau >
- Chart of year

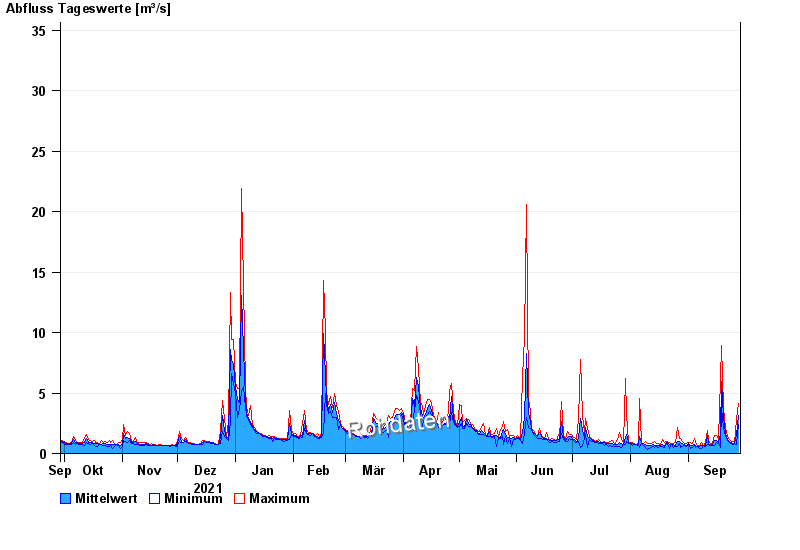
Chart of year Grafenau / Kleine Ohe
Discharge from 29.09.2021 to 28.09.2022
- 12.08.2002 Abfluss: 71,2 m³/s
- 13.08.2002 Abfluss: 66,3 m³/s
- 21.12.1993 Abfluss: 51,4 m³/s
- 21.03.2002 Abfluss: 47,3 m³/s
- 09.08.2002 Abfluss: 37,2 m³/s
| Date | Mean value [m³/s] | Maximum [m³/s] | Minimum [m³/s] |
|---|---|---|---|
| 28.09.2022 | 3.18 | 4.17 | 2.42 |
| 27.09.2022 | 1.5 | 2.8 | 0.767 |
| 26.09.2022 | 0.826 | 0.84 | 0.803 |
| 25.09.2022 | 0.847 | 0.954 | 0.767 |
| 24.09.2022 | 0.885 | 0.954 | 0.84 |
| 23.09.2022 | 1.01 | 1.13 | 0.915 |
| 22.09.2022 | 1.16 | 1.4 | 1.04 |
© Bayerisches Landesamt für Umwelt 2024