
- Start >
- Rivers >
- Discharge >
- Untere Donau >
- Grafenau >
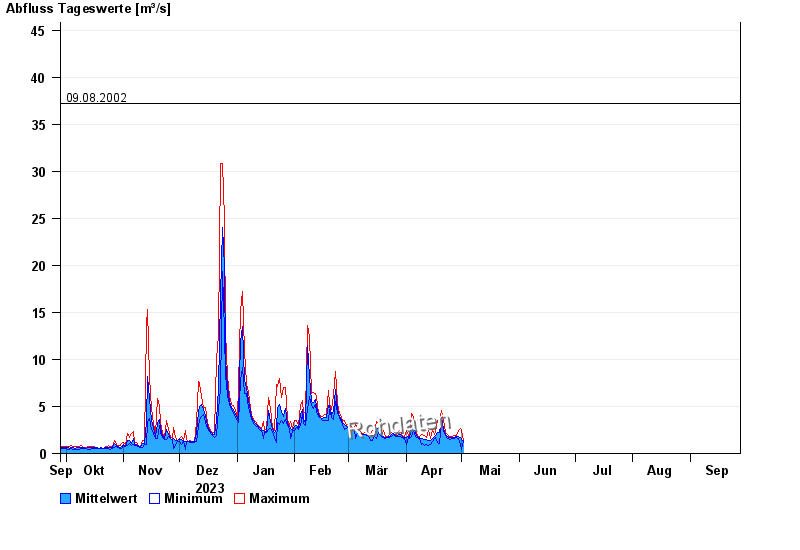
- Chart of year

Chart of year Grafenau / Kleine Ohe
Discharge from 28.09.2023 to 27.09.2024
- 12.08.2002 Abfluss: 71,2 m³/s
- 13.08.2002 Abfluss: 66,3 m³/s
- 21.12.1993 Abfluss: 51,4 m³/s
- 21.03.2002 Abfluss: 47,3 m³/s
- 09.08.2002 Abfluss: 37,2 m³/s
| Date | Mean value [m³/s] | Maximum [m³/s] | Minimum [m³/s] |
|---|---|---|---|
| 19.04.2024 | 2.03 | 2.31 | 1.76 |
| 18.04.2024 | 2.26 | 3.54 | 1.17 |
| 17.04.2024 | 1.87 | 2.31 | 1.7 |
| 16.04.2024 | 1.77 | 1.98 | 1.63 |
| 15.04.2024 | 1.57 | 2.4 | 1.32 |
| 14.04.2024 | 1.37 | 1.57 | 0.981 |
| 13.04.2024 | 1.42 | 2.4 | 0.903 |
© Bayerisches Landesamt für Umwelt 2024