
- Start >
- Rivers >
- Discharge >
- Untere Donau >
- Grafenau >
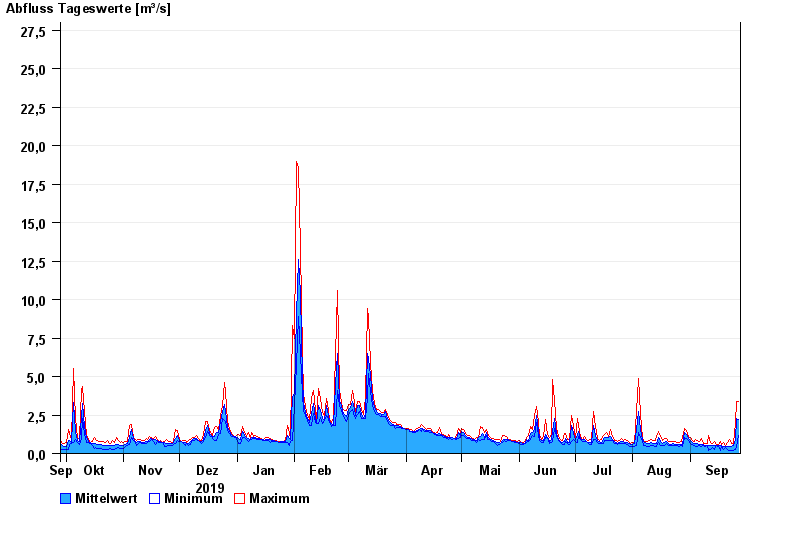
- Chart of year

Chart of year Grafenau / Kleine Ohe
Discharge from 28.09.2019 to 27.09.2020
- 12.08.2002 Abfluss: 71,2 m³/s
- 13.08.2002 Abfluss: 66,3 m³/s
- 21.12.1993 Abfluss: 51,4 m³/s
- 21.03.2002 Abfluss: 47,3 m³/s
- 09.08.2002 Abfluss: 37,2 m³/s
| Date | Mean value [m³/s] | Maximum [m³/s] | Minimum [m³/s] |
|---|---|---|---|
| 27.09.2020 | 2.2 | 3.39 | 1.16 |
| 26.09.2020 | 2.29 | 3.39 | 0.459 |
| 25.09.2020 | 0.918 | 1.92 | 0.246 |
| 24.09.2020 | 0.516 | 0.655 | 0.219 |
| 23.09.2020 | 0.482 | 0.655 | 0.219 |
| 22.09.2020 | 0.469 | 0.891 | 0.22 |
| 21.09.2020 | 0.477 | 0.712 | 0.247 |
© Bayerisches Landesamt für Umwelt 2024