
- Start >
- Rivers >
- Discharge >
- Untere Donau >
- Grafenau >
- Chart of year

Chart of year Grafenau / Kleine Ohe
Discharge from 28.09.2022 to 27.09.2023
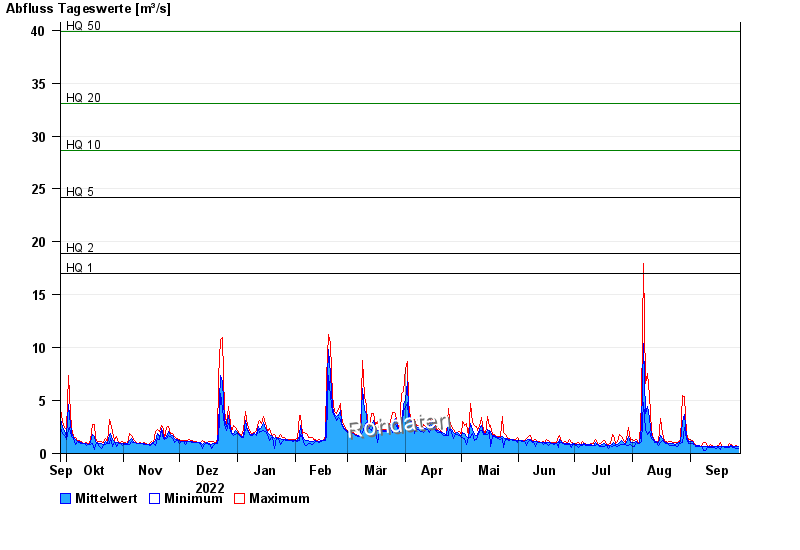
- HQ1 17 m³/s
- HQ2 18,9 m³/s
- HQ5 24,2 m³/s
- HQ10 28,6 m³/s
- HQ20 33,1 m³/s
- HQ50 39,9 m³/s
- HQ100 45,4 m³/s
| Date | Mean value [m³/s] | Maximum [m³/s] | Minimum [m³/s] |
|---|---|---|---|
| 27.09.2023 | 0.626 | 0.707 | 0.498 |
| 26.09.2023 | 0.629 | 0.774 | 0.47 |
| 25.09.2023 | 0.638 | 0.645 | 0.613 |
| 24.09.2023 | 0.666 | 0.707 | 0.613 |
| 23.09.2023 | 0.763 | 0.881 | 0.645 |
| 22.09.2023 | 0.684 | 0.919 | 0.613 |
| 21.09.2023 | 0.634 | 0.645 | 0.613 |
© Bayerisches Landesamt für Umwelt 2024