
- Start >
- Rivers >
- Discharge >
- Untere Donau >
- Grafenau >
- Chart of year

Chart of year Grafenau / Kleine Ohe
Discharge from 28.09.2020 to 27.09.2021
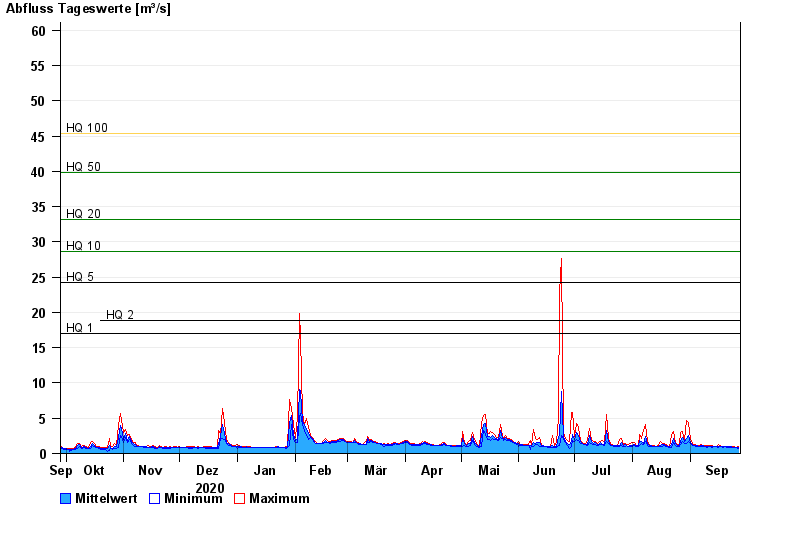
- HQ1 17 m³/s
- HQ2 18,9 m³/s
- HQ5 24,2 m³/s
- HQ10 28,6 m³/s
- HQ20 33,1 m³/s
- HQ50 39,9 m³/s
- HQ100 45,4 m³/s
| Date | Mean value [m³/s] | Maximum [m³/s] | Minimum [m³/s] |
|---|---|---|---|
| 27.09.2021 | 0.898 | 1.04 | 0.683 |
| 26.09.2021 | 0.883 | 0.919 | 0.839 |
| 25.09.2021 | 0.92 | 0.922 | 0.879 |
| 24.09.2021 | 0.911 | 0.965 | 0.844 |
| 23.09.2021 | 0.924 | 0.968 | 0.886 |
| 22.09.2021 | 0.923 | 1.01 | 0.847 |
| 21.09.2021 | 0.948 | 1.06 | 0.811 |
© Bayerisches Landesamt für Umwelt 2024