
- Start >
- Rivers >
- Discharge >
- Untere Donau >
- Grafenau >
- Chart of year

Chart of year Grafenau / Kleine Ohe
Discharge from 21.09.2022 to 20.09.2023
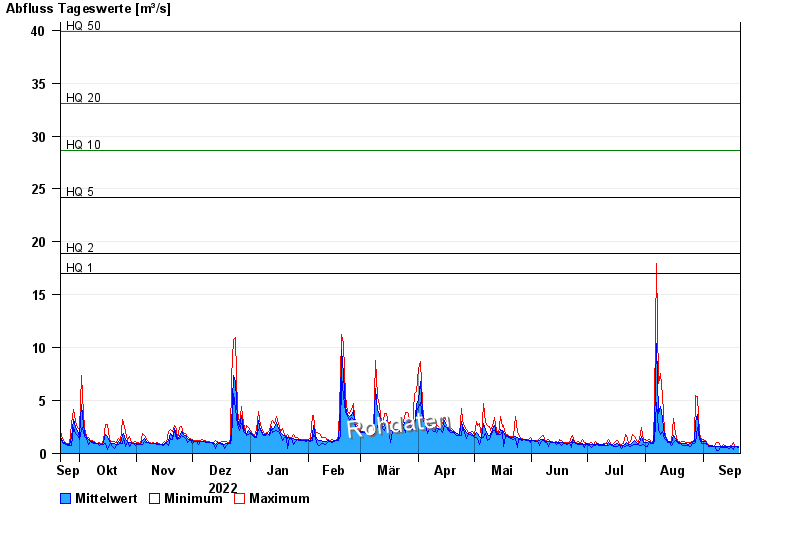
- HQ1 17 m³/s
- HQ2 18,9 m³/s
- HQ5 24,2 m³/s
- HQ10 28,6 m³/s
- HQ20 33,1 m³/s
- HQ50 39,9 m³/s
- HQ100 45,4 m³/s
| Date | Mean value [m³/s] | Maximum [m³/s] | Minimum [m³/s] |
|---|---|---|---|
| 20.09.2023 | 0.659 | 0.678 | 0.613 |
| 19.09.2023 | 0.681 | 0.707 | 0.678 |
| 18.09.2023 | 0.636 | 0.74 | 0.584 |
| 17.09.2023 | 0.632 | 1.05 | 0.348 |
| 16.09.2023 | 0.629 | 0.74 | 0.525 |
| 15.09.2023 | 0.633 | 0.645 | 0.443 |
| 14.09.2023 | 0.649 | 0.678 | 0.613 |
© Bayerisches Landesamt für Umwelt 2024