
- Start >
- Rivers >
- Discharge >
- Untere Donau >
- Grafenau >
- Chart of total period

Chart of total period Grafenau / Kleine Ohe
Discharge from 01.11.1962 to 25.04.2024
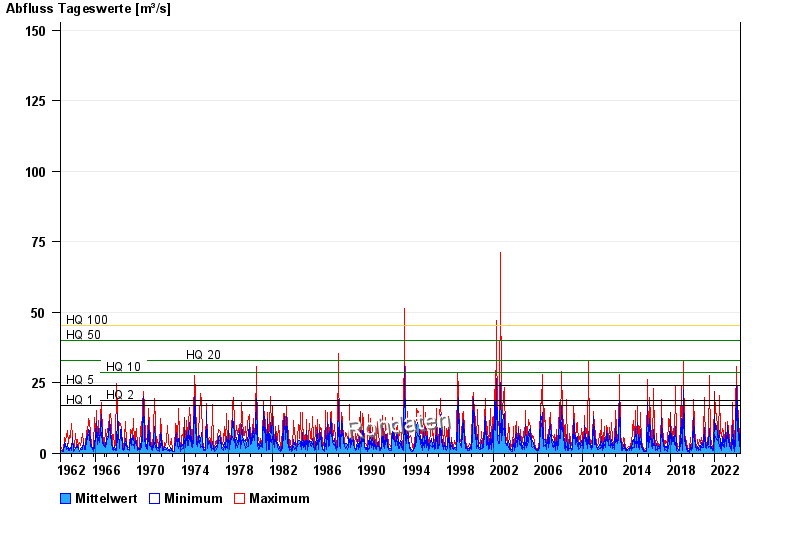
- HQ1 17 m³/s
- HQ2 18,9 m³/s
- HQ5 24,2 m³/s
- HQ10 28,6 m³/s
- HQ20 33,1 m³/s
- HQ50 39,9 m³/s
- HQ100 45,4 m³/s
| Date | Mean value [m³/s] | Maximum [m³/s] | Minimum [m³/s] |
|---|---|---|---|
| 25.04.2024 | 1.72 | 1.84 | 1.44 |
| 24.04.2024 | 1.73 | 1.76 | 1.57 |
| 23.04.2024 | 1.82 | 1.98 | 1.63 |
| 22.04.2024 | 2.04 | 2.23 | 1.91 |
| 21.04.2024 | 2.67 | 3.54 | 2.31 |
| 20.04.2024 | 3.8 | 4.53 | 3.31 |
| 19.04.2024 | 2.28 | 3.66 | 1.02 |
© Bayerisches Landesamt für Umwelt 2024