
- Start >
- Rivers >
- Discharge >
- Untere Donau >
- Eggenfelden >
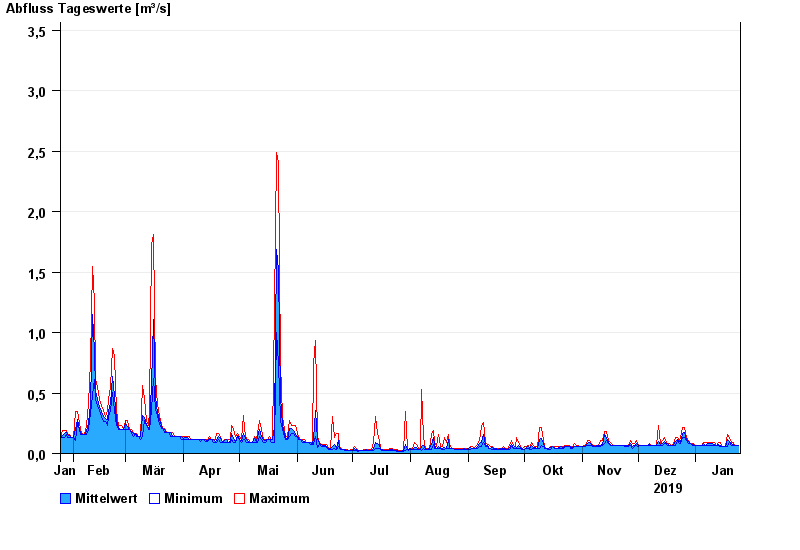
- Chart of year

Chart of year Eggenfelden / Mertseebach
Discharge from 25.01.2019 to 24.01.2020
- 02.03.1987 Abfluss: 13,3 m³/s
- 13.01.2011 Abfluss: 12,8 m³/s
- 02.06.2013 Abfluss: 11,5 m³/s
- 02.08.1991 Abfluss: 11,2 m³/s
- 17.07.2010 Abfluss: 9,99 m³/s
| Date | Mean value [m³/s] | Maximum [m³/s] | Minimum [m³/s] |
|---|---|---|---|
| 24.01.2020 | 0.07 | 0.07 | 0.07 |
| 23.01.2020 | 0.07 | 0.07 | 0.07 |
| 22.01.2020 | 0.07 | 0.07 | 0.07 |
| 21.01.2020 | 0.071 | 0.087 | 0.07 |
| 20.01.2020 | 0.085 | 0.087 | 0.07 |
| 19.01.2020 | 0.103 | 0.13 | 0.087 |
| 18.01.2020 | 0.114 | 0.156 | 0.055 |
© Bayerisches Landesamt für Umwelt 2024