
- Start >
- Rivers >
- Discharge >
- Untere Donau >
- Eggenfelden >
- Chart of year

Chart of year Eggenfelden / Mertseebach
Discharge from 06.12.2020 to 05.12.2021
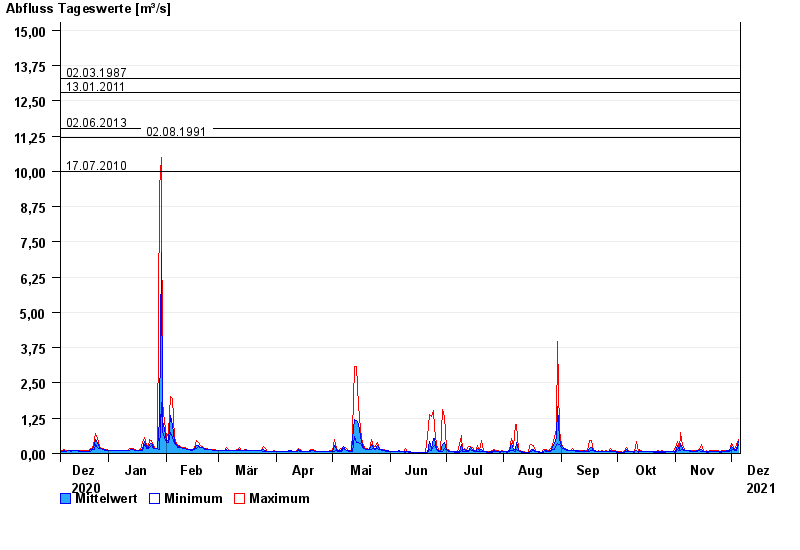
- 02.03.1987 Abfluss: 13,3 m³/s
- 13.01.2011 Abfluss: 12,8 m³/s
- 02.06.2013 Abfluss: 11,5 m³/s
- 02.08.1991 Abfluss: 11,2 m³/s
- 17.07.2010 Abfluss: 9,99 m³/s
| Date | Mean value [m³/s] | Maximum [m³/s] | Minimum [m³/s] |
|---|---|---|---|
| 05.12.2021 | 0.416 | 0.508 | 0.313 |
| 04.12.2021 | 0.154 | 0.313 | 0.114 |
| 03.12.2021 | 0.129 | 0.139 | 0.114 |
| 02.12.2021 | 0.182 | 0.233 | 0.139 |
| 01.12.2021 | 0.242 | 0.358 | 0.114 |
| 30.11.2021 | 0.095 | 0.114 | 0.075 |
| 29.11.2021 | 0.093 | 0.094 | 0.075 |
© Bayerisches Landesamt für Umwelt 2024