
- Start >
- Rivers >
- Discharge >
- Untere Donau >
- Dietelskirchen >
- Chart of total period

Chart of total period Dietelskirchen / Kleine Vils
Discharge from 01.11.1969 to 18.04.2024
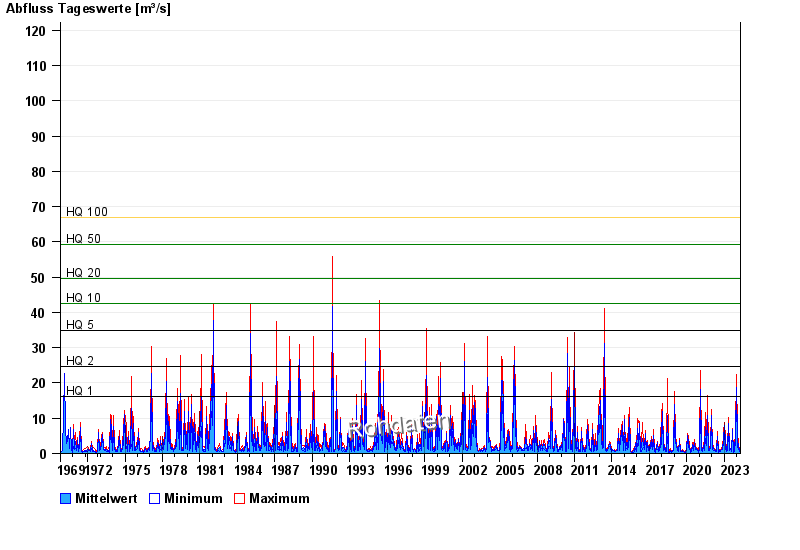
- HQ1 16,3 m³/s
- HQ2 24,7 m³/s
- HQ5 34,8 m³/s
- HQ10 42,4 m³/s
- HQ20 49,6 m³/s
- HQ50 59,3 m³/s
- HQ100 67 m³/s
| Date | Mean value [m³/s] | Maximum [m³/s] | Minimum [m³/s] |
|---|---|---|---|
| 18.04.2024 | 0.745 | 0.745 | 0.745 |
| 17.04.2024 | 0.686 | 0.745 | 0.66 |
| 16.04.2024 | 0.802 | 0.961 | 0.66 |
| 15.04.2024 | 0.576 | 0.961 | 0.489 |
| 14.04.2024 | 0.479 | 0.489 | 0.449 |
| 13.04.2024 | 0.475 | 0.489 | 0.449 |
| 12.04.2024 | 0.526 | 0.571 | 0.489 |
© Bayerisches Landesamt für Umwelt 2024