
- Start >
- Rivers >
- Discharge >
- Untere Donau >
- Deggendorf >
- Chart of year

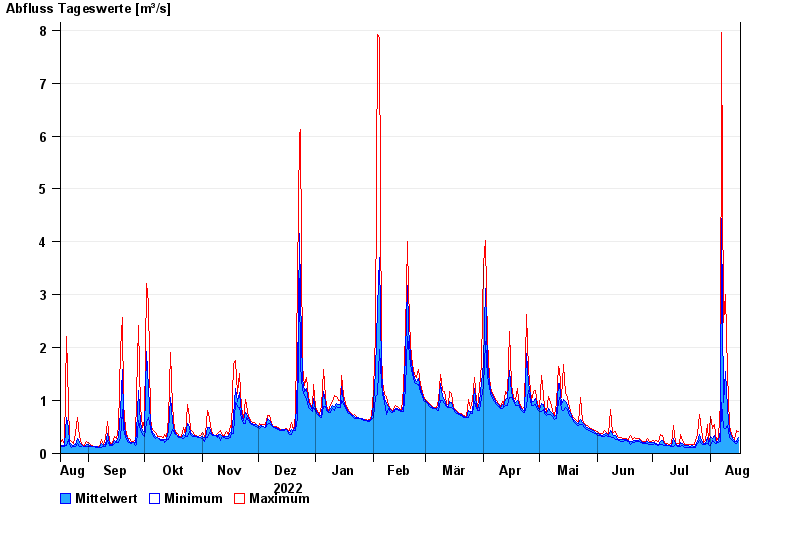
Chart of year Deggendorf / Kollbach
Discharge from 17.08.2022 to 16.08.2023
| Date | Mean value [m³/s] | Maximum [m³/s] | Minimum [m³/s] |
|---|---|---|---|
| 16.08.2023 | 0.3 | 0.417 | 0.238 |
| 15.08.2023 | 0.229 | 0.44 | 0.19 |
| 14.08.2023 | 0.236 | 0.269 | 0.199 |
| 13.08.2023 | 0.262 | 0.302 | 0.231 |
| 12.08.2023 | 0.312 | 0.351 | 0.258 |
| 11.08.2023 | 0.429 | 0.524 | 0.299 |
| 10.08.2023 | 0.843 | 1.54 | 0.524 |
© Bayerisches Landesamt für Umwelt 2024