
- Start >
- Rivers >
- Discharge >
- Untere Donau >
- Deggendorf >
- Chart of year

Chart of year Deggendorf / Kollbach
Discharge from 01.01.2023 to 31.12.2023
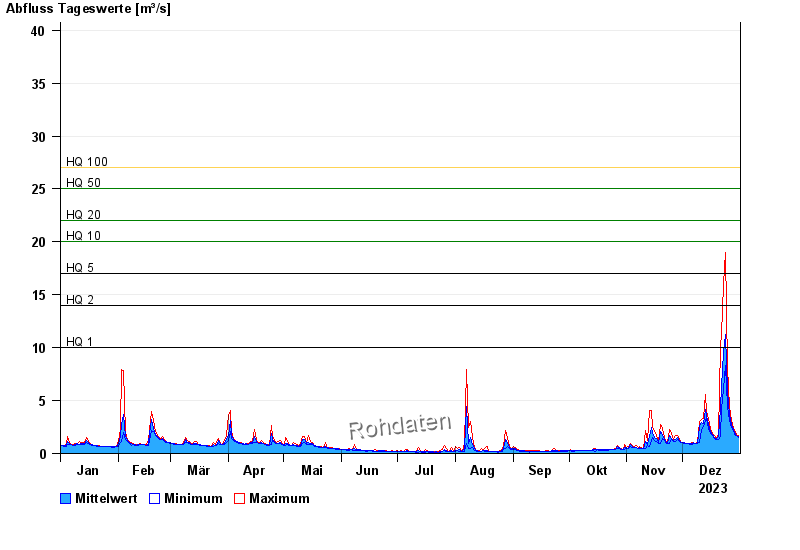
- HQ1 10 m³/s
- HQ2 14 m³/s
- HQ5 17 m³/s
- HQ10 20 m³/s
- HQ20 22 m³/s
- HQ50 25 m³/s
- HQ100 27 m³/s
| Date | Mean value [m³/s] | Maximum [m³/s] | Minimum [m³/s] |
|---|---|---|---|
| 31.12.2023 | 1.59 | 1.67 | 1.51 |
| 30.12.2023 | 1.74 | 1.83 | 1.67 |
| 29.12.2023 | 1.97 | 2.18 | 1.83 |
| 28.12.2023 | 2.28 | 2.47 | 2.18 |
| 27.12.2023 | 2.77 | 3.12 | 2.47 |
| 26.12.2023 | 3.71 | 4.47 | 3.12 |
| 25.12.2023 | 5.87 | 8.11 | 4.47 |
© Bayerisches Landesamt für Umwelt 2024