
- Start >
- Rivers >
- Discharge >
- Untere Donau >
- Deggendorf >
- Chart of year

Chart of year Deggendorf / Kollbach
Discharge from 01.01.2019 to 31.12.2019
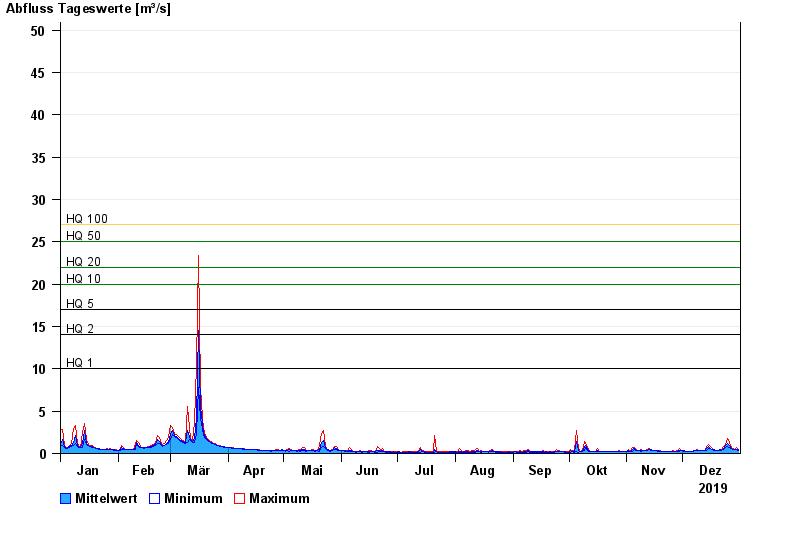
- HQ1 10 m³/s
- HQ2 14 m³/s
- HQ5 17 m³/s
- HQ10 20 m³/s
- HQ20 22 m³/s
- HQ50 25 m³/s
- HQ100 27 m³/s
| Date | Mean value [m³/s] | Maximum [m³/s] | Minimum [m³/s] |
|---|---|---|---|
| 31.12.2019 | 0.417 | 0.429 | 0.408 |
| 30.12.2019 | 0.446 | 0.72 | 0.429 |
| 29.12.2019 | 0.468 | 0.488 | 0.447 |
| 28.12.2019 | 0.53 | 0.57 | 0.488 |
| 27.12.2019 | 0.638 | 0.725 | 0.565 |
| 26.12.2019 | 0.913 | 1.28 | 0.725 |
| 25.12.2019 | 1.19 | 1.76 | 0.823 |
© Bayerisches Landesamt für Umwelt 2024