
- Start >
- Rivers >
- Discharge >
- Untere Donau >
- Deggendorf >
- Chart of year

Chart of year Deggendorf / Kollbach
Discharge from 01.01.2024 to 24.04.2024
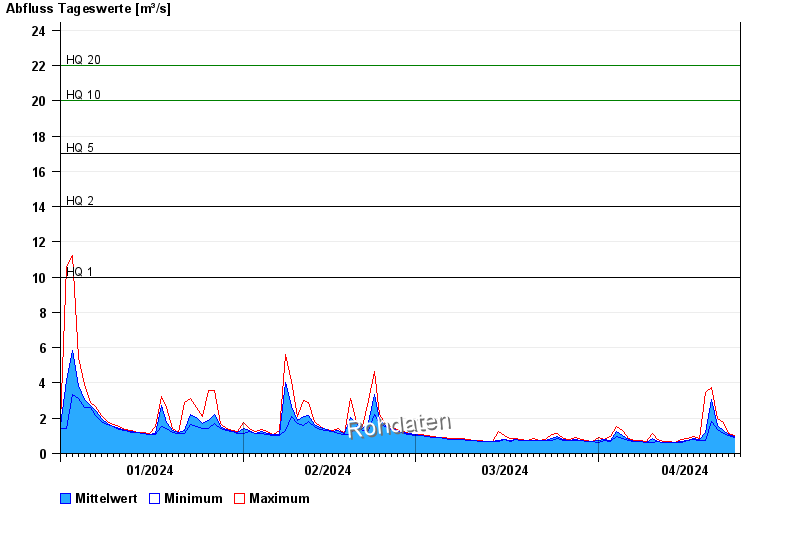
- HQ1 10 m³/s
- HQ2 14 m³/s
- HQ5 17 m³/s
- HQ10 20 m³/s
- HQ20 22 m³/s
- HQ50 25 m³/s
- HQ100 27 m³/s
| Date | Mean value [m³/s] | Maximum [m³/s] | Minimum [m³/s] |
|---|---|---|---|
| 24.04.2024 | 0.964 | 1.02 | 0.958 |
| 23.04.2024 | 1.07 | 1.16 | 1.02 |
| 22.04.2024 | 1.33 | 1.76 | 1.16 |
| 21.04.2024 | 1.6 | 2.01 | 1.37 |
| 20.04.2024 | 3.05 | 3.72 | 1.84 |
| 19.04.2024 | 1.19 | 3.48 | 0.718 |
| 18.04.2024 | 0.775 | 0.832 | 0.718 |
© Bayerisches Landesamt für Umwelt 2024