
- Start >
- Rivers >
- Discharge >
- Untere Donau >
- Deggendorf >
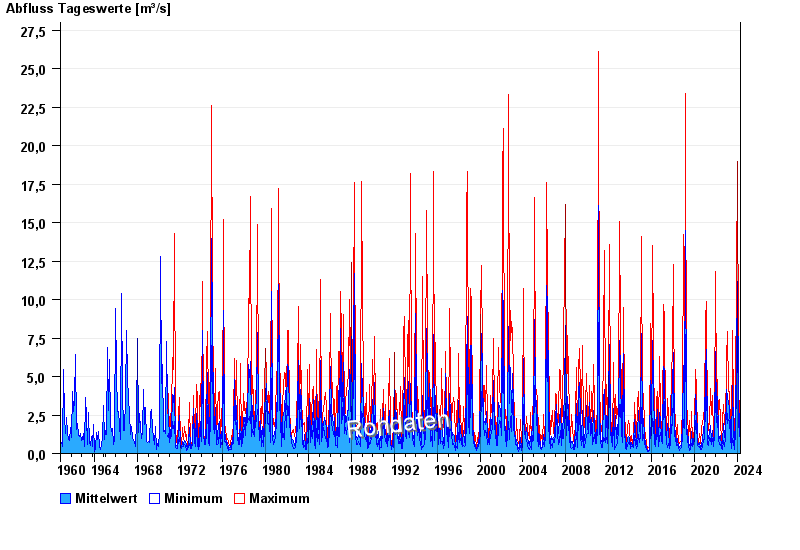
- Chart of total period

Chart of total period Deggendorf / Kollbach
Discharge from 01.11.1960 to 19.04.2024
| Date | Mean value [m³/s] | Maximum [m³/s] | Minimum [m³/s] |
|---|---|---|---|
| 19.04.2024 | 0.718 | 0.718 | 0.718 |
| 18.04.2024 | 0.775 | 0.832 | 0.718 |
| 17.04.2024 | 0.856 | 0.958 | 0.775 |
| 16.04.2024 | 0.738 | 0.832 | 0.718 |
| 15.04.2024 | 0.674 | 0.775 | 0.611 |
| 14.04.2024 | 0.611 | 0.611 | 0.611 |
| 13.04.2024 | 0.625 | 0.664 | 0.611 |
© Bayerisches Landesamt für Umwelt 2024