
- Start >
- Rivers >
- Discharge >
- Untere Donau >
- Auerbach >
- Chart of year

Chart of year Auerbach / Hengersberger Ohe
Discharge from 01.08.2021 to 31.07.2022
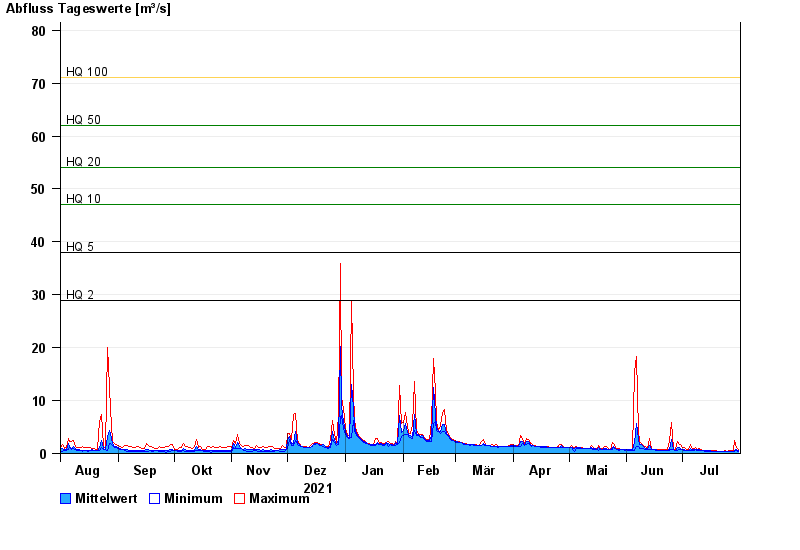
- HQ2 29 m³/s
- HQ5 38 m³/s
- HQ10 47 m³/s
- HQ20 54 m³/s
- HQ50 62 m³/s
- HQ100 71 m³/s
| Date | Mean value [m³/s] | Maximum [m³/s] | Minimum [m³/s] |
|---|---|---|---|
| 31.07.2022 | 0.554 | 0.845 | 0.451 |
| 30.07.2022 | 0.708 | 1.08 | 0.567 |
| 29.07.2022 | 0.539 | 2.54 | 0.354 |
| 28.07.2022 | 0.388 | 0.634 | 0.355 |
| 27.07.2022 | 0.412 | 0.57 | 0.403 |
| 26.07.2022 | 0.433 | 0.571 | 0.357 |
| 25.07.2022 | 0.389 | 0.406 | 0.357 |
© Bayerisches Landesamt für Umwelt 2024