
- Start >
- Rivers >
- Discharge >
- Untere Donau >
- Auerbach >
- Chart of total period

Chart of total period Auerbach / Hengersberger Ohe
Discharge from 01.11.1964 to 25.04.2024
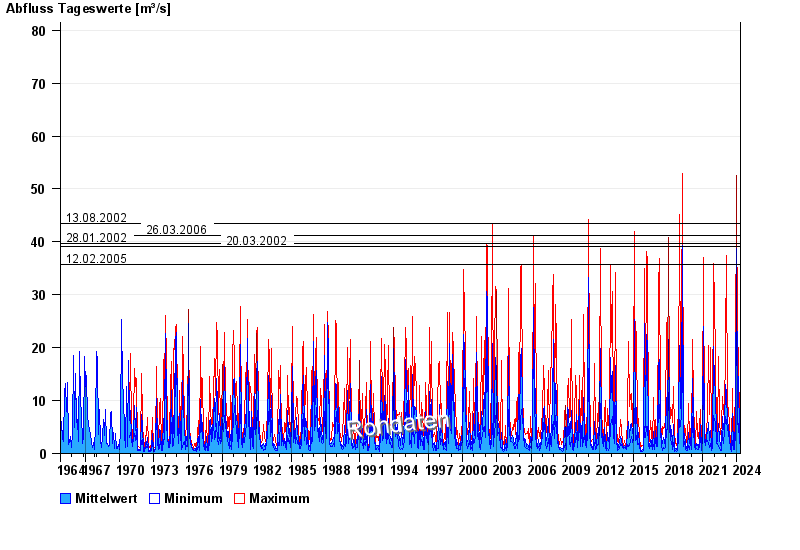
- 13.08.2002 Abfluss: 43,5 m³/s
- 26.03.2006 Abfluss: 41,2 m³/s
- 28.01.2002 Abfluss: 39,6 m³/s
- 20.03.2002 Abfluss: 39,1 m³/s
- 12.02.2005 Abfluss: 35,7 m³/s
| Date | Mean value [m³/s] | Maximum [m³/s] | Minimum [m³/s] |
|---|---|---|---|
| 25.04.2024 | 2.25 | 2.75 | 1.99 |
| 24.04.2024 | 2.21 | 2.29 | 2.06 |
| 23.04.2024 | 2.49 | 2.75 | 2.29 |
| 22.04.2024 | 3.21 | 4.3 | 2.75 |
| 21.04.2024 | 3.87 | 5.1 | 3.05 |
| 20.04.2024 | 8.17 | 11.8 | 4.62 |
| 19.04.2024 | 3.03 | 11.3 | 1.59 |
© Bayerisches Landesamt für Umwelt 2024