
- Start >
- Rivers >
- Discharge >
- Untere Donau >
- Arzberg >
- Chart of year

Chart of year Arzberg / Röslau
Discharge from 20.09.2019 to 19.09.2020
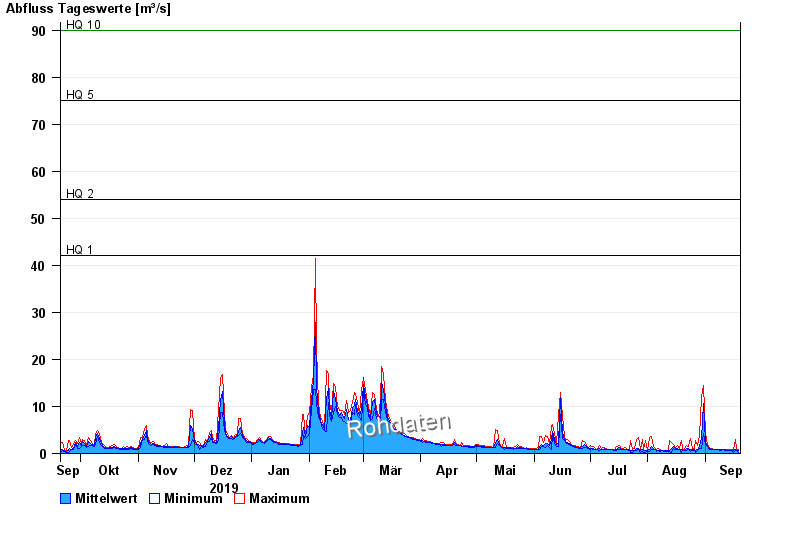
- HQ1 42 m³/s
- HQ2 54 m³/s
- HQ5 75 m³/s
- HQ10 90 m³/s
- HQ20 105 m³/s
- HQ50 124 m³/s
- HQ100 140 m³/s
| Date | Mean value [m³/s] | Maximum [m³/s] | Minimum [m³/s] |
|---|---|---|---|
| 19.09.2020 | 0.636 | 0.828 | 0.264 |
| 18.09.2020 | 0.705 | 0.828 | 0.624 |
| 17.09.2020 | 0.834 | 2.92 | 0.624 |
| 16.09.2020 | 0.592 | 0.828 | 0.21 |
| 15.09.2020 | 0.729 | 0.904 | 0.688 |
| 14.09.2020 | 0.719 | 0.828 | 0.688 |
| 13.09.2020 | 0.712 | 0.755 | 0.624 |
© Bayerisches Landesamt für Umwelt 2024