
- Start >
- Rivers >
- Discharge >
- Untere Donau >
- Arzberg >
- Chart of total period

Chart of total period Arzberg / Röslau
Discharge from 01.11.1976 to 20.04.2024
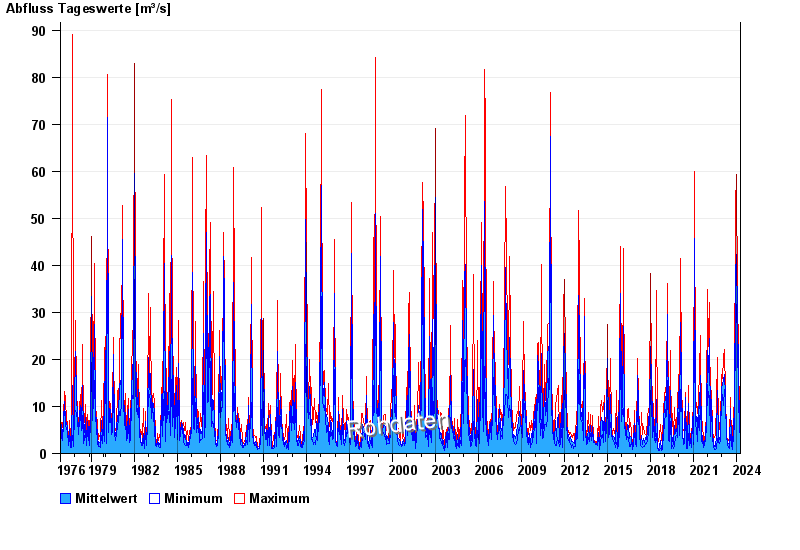
| Date | Mean value [m³/s] | Maximum [m³/s] | Minimum [m³/s] |
|---|---|---|---|
| 20.04.2024 | 3.92 | 4.1 | 3.8 |
| 19.04.2024 | 2.59 | 3.8 | 2.21 |
| 18.04.2024 | 2.46 | 2.57 | 2.33 |
| 17.04.2024 | 3.06 | 3.5 | 2.57 |
| 16.04.2024 | 2.42 | 3.5 | 2.1 |
| 15.04.2024 | 2.06 | 2.1 | 1.98 |
| 14.04.2024 | 2.05 | 2.1 | 1.98 |
© Bayerisches Landesamt für Umwelt 2024