
- Start >
- Rivers >
- Discharge >
- Untere Donau >
- Arzberg >
- Chart of total period

Chart of total period Arzberg / Röslau
Discharge from 01.11.1976 to 25.04.2024
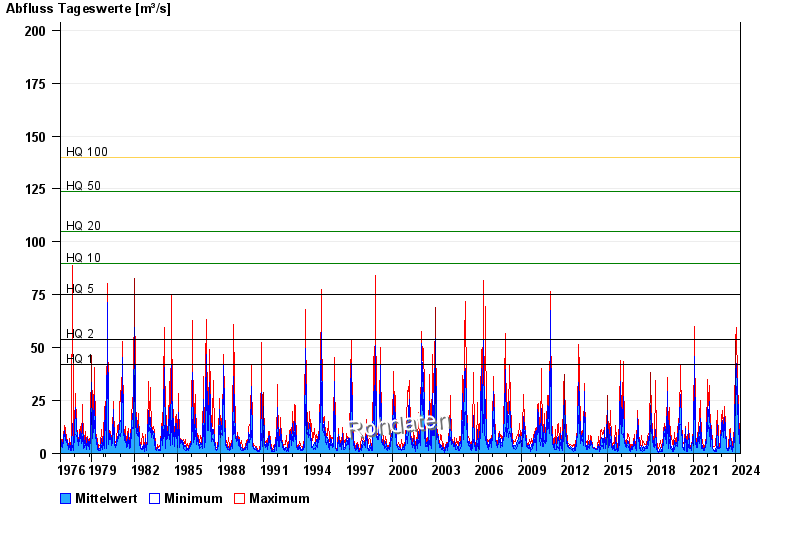
- HQ1 42 m³/s
- HQ2 54 m³/s
- HQ5 75 m³/s
- HQ10 90 m³/s
- HQ20 105 m³/s
- HQ50 124 m³/s
- HQ100 140 m³/s
| Date | Mean value [m³/s] | Maximum [m³/s] | Minimum [m³/s] |
|---|---|---|---|
| 25.04.2024 | 3.45 | 3.5 | 3.36 |
| 24.04.2024 | 3.73 | 4.26 | 3.5 |
| 23.04.2024 | 4.53 | 5.94 | 3.95 |
| 22.04.2024 | 5.29 | 7.51 | 4.42 |
| 21.04.2024 | 5.51 | 7.82 | 4.42 |
| 20.04.2024 | 4.97 | 5.52 | 3.8 |
| 19.04.2024 | 2.59 | 3.8 | 2.21 |
© Bayerisches Landesamt für Umwelt 2024