
- Start >
- Rivers >
- Discharge >
- Untere Donau >
- Appolding >
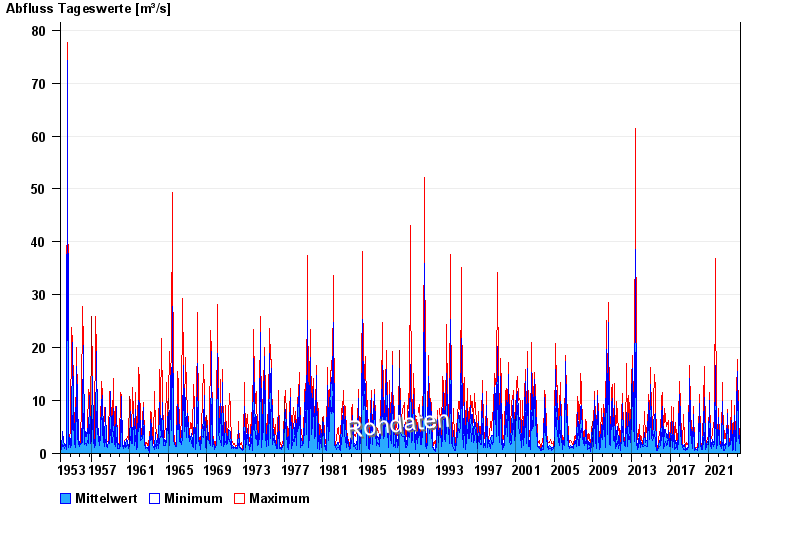
- Chart of total period

Chart of total period Appolding / Strogen
Discharge from 01.11.1953 to 19.04.2024
| Date | Mean value [m³/s] | Maximum [m³/s] | Minimum [m³/s] |
|---|---|---|---|
| 19.04.2024 | 1.26 | 1.45 | 0.912 |
| 18.04.2024 | 1.64 | 1.82 | 1.45 |
| 17.04.2024 | 1.36 | 1.73 | 0.979 |
| 16.04.2024 | 1.06 | 1.37 | 0.845 |
| 15.04.2024 | 1.1 | 1.63 | 0.845 |
| 14.04.2024 | 0.922 | 1.05 | 0.845 |
| 13.04.2024 | 0.965 | 1.28 | 0.78 |
© Bayerisches Landesamt für Umwelt 2024