
- Start >
- Rivers >
- Discharge >
- Untere Donau >
- Appolding >
- Chart of total period

Chart of total period Appolding / Strogen
Discharge from 01.11.1953 to 26.04.2024
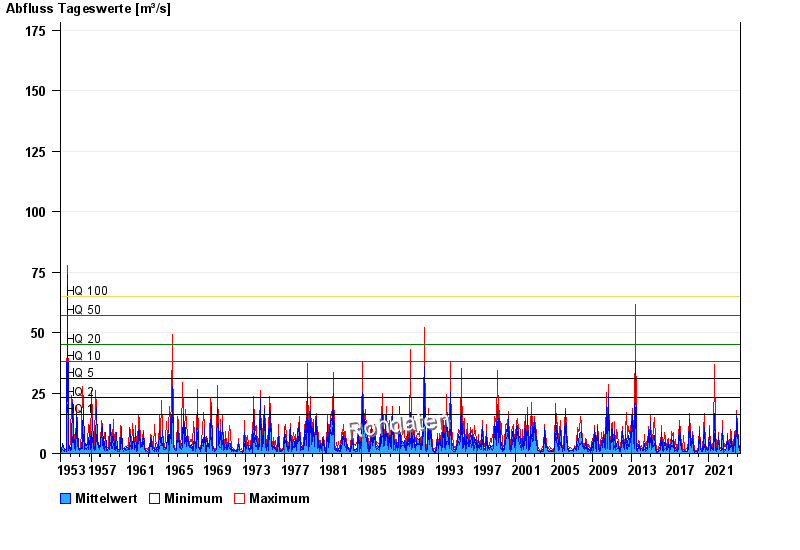
- HQ1 16 m³/s
- HQ2 23 m³/s
- HQ5 31 m³/s
- HQ10 38 m³/s
- HQ20 45 m³/s
- HQ50 57 m³/s
- HQ100 65 m³/s
| Date | Mean value [m³/s] | Maximum [m³/s] | Minimum [m³/s] |
|---|---|---|---|
| 26.04.2024 | 1.28 | 1.28 | 1.28 |
| 25.04.2024 | 1.29 | 1.37 | 1.21 |
| 24.04.2024 | 1.39 | 1.45 | 1.28 |
| 23.04.2024 | 1.57 | 1.73 | 1.45 |
| 22.04.2024 | 1.68 | 1.92 | 1.45 |
| 21.04.2024 | 1.25 | 1.45 | 1.05 |
| 20.04.2024 | 1.24 | 1.37 | 1.05 |
© Bayerisches Landesamt für Umwelt 2024