
- Start >
- Rivers >
- Discharge >
- Untere Donau >
- Aham >
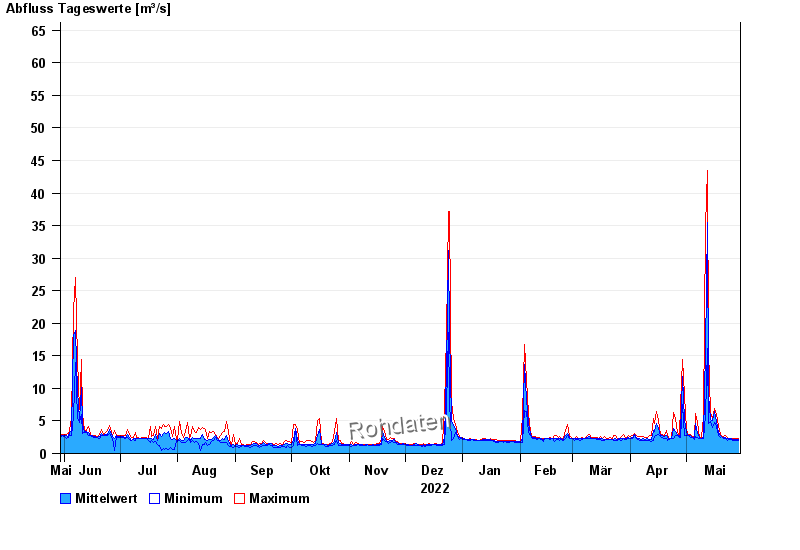
- Chart of year

Chart of year Aham / Vils
Discharge from 30.05.2022 to 29.05.2023
- 03.06.2013 Abfluss: 231 m³/s
- 01.02.1985 Abfluss: 197 m³/s
- 04.08.1991 Abfluss: 196 m³/s
- 22.02.1970 Abfluss: 194 m³/s
- 20.02.1999 Abfluss: 176 m³/s
| Date | Mean value [m³/s] | Maximum [m³/s] | Minimum [m³/s] |
|---|---|---|---|
| 29.05.2023 | 2.12 | 2.25 | 1.94 |
| 28.05.2023 | 2.15 | 2.25 | 2.04 |
| 27.05.2023 | 2.18 | 2.36 | 2.04 |
| 26.05.2023 | 2.21 | 2.36 | 2.04 |
| 25.05.2023 | 2.24 | 2.36 | 2.15 |
| 24.05.2023 | 2.24 | 2.36 | 2.15 |
| 23.05.2023 | 2.29 | 2.47 | 2.04 |
© Bayerisches Landesamt für Umwelt 2024