
- Start >
- Rivers >
- Discharge >
- Untere Donau >
- Aham >
- Chart of year

Chart of year Aham / Vils
Discharge from 06.08.2021 to 05.08.2022
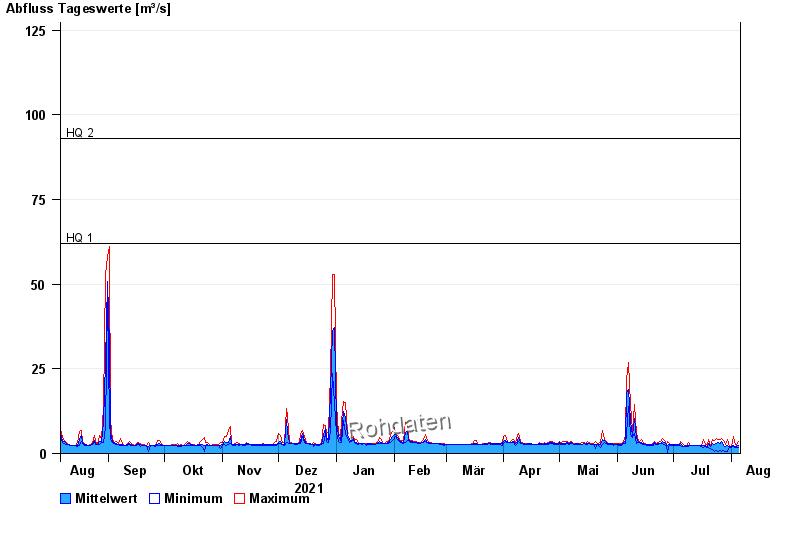
- HQ1 62 m³/s
- HQ2 93 m³/s
- HQ5 130 m³/s
- HQ10 165 m³/s
- HQ20 195 m³/s
- HQ50 243 m³/s
- HQ100 280 m³/s
| Date | Mean value [m³/s] | Maximum [m³/s] | Minimum [m³/s] |
|---|---|---|---|
| 05.08.2022 | 2.41 | 3.4 | 1.73 |
| 04.08.2022 | 2.02 | 2.44 | 1.73 |
| 03.08.2022 | 2.06 | 3.15 | 1.73 |
| 02.08.2022 | 2.36 | 4.94 | 2.02 |
| 01.08.2022 | 2 | 2.12 | 1.82 |
| 31.07.2022 | 2.01 | 2.12 | 1.92 |
| 30.07.2022 | 2.3 | 4.21 | 0.63 |
© Bayerisches Landesamt für Umwelt 2024