
- Start >
- Rivers >
- Discharge >
- Untere Donau >
- Aham >
- Chart of year

Chart of year Aham / Vils
Discharge from 19.09.2021 to 18.09.2022
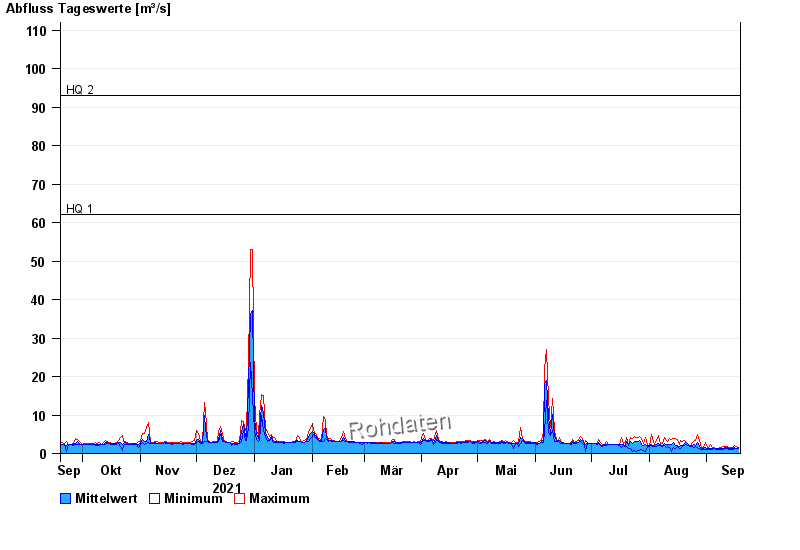
- HQ1 62 m³/s
- HQ2 93 m³/s
- HQ5 130 m³/s
- HQ10 165 m³/s
- HQ20 195 m³/s
- HQ50 243 m³/s
- HQ100 280 m³/s
| Date | Mean value [m³/s] | Maximum [m³/s] | Minimum [m³/s] |
|---|---|---|---|
| 18.09.2022 | 1.43 | 1.6 | 1.27 |
| 17.09.2022 | 1.42 | 1.69 | 1.2 |
| 16.09.2022 | 1.64 | 2.07 | 1.27 |
| 15.09.2022 | 1.32 | 1.6 | 1.13 |
| 14.09.2022 | 1.26 | 1.52 | 0.926 |
| 13.09.2022 | 1.27 | 1.44 | 1.13 |
| 12.09.2022 | 1.49 | 1.69 | 1.27 |
© Bayerisches Landesamt für Umwelt 2024