
- Start >
- Rivers >
- Discharge >
- Naab - Regen >
- Windischeschenbach >
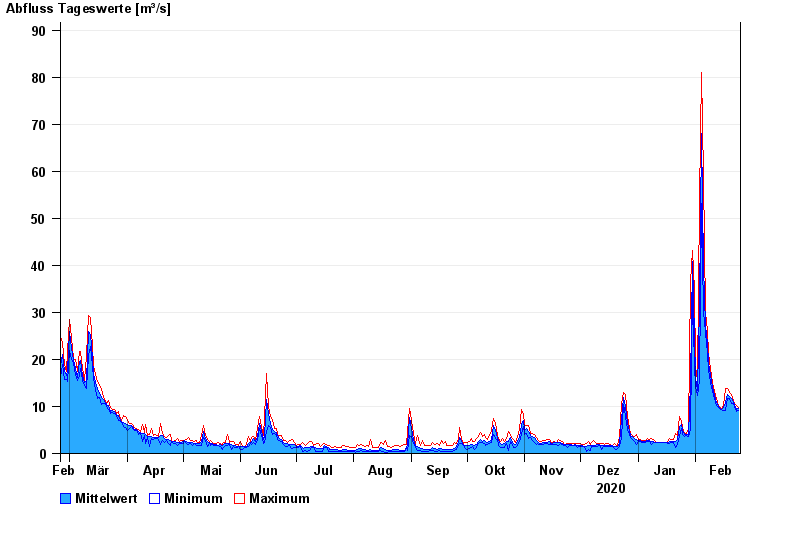
- Chart of year

Chart of year Windischeschenbach / Waldnaab
Discharge from 25.02.2020 to 24.02.2021
| Date | Mean value [m³/s] | Maximum [m³/s] | Minimum [m³/s] |
|---|---|---|---|
| 24.02.2021 | 9.53 | 9.79 | 9.2 |
| 23.02.2021 | 9.41 | 10.1 | 8.91 |
| 22.02.2021 | 10.3 | 10.7 | 9.79 |
| 21.02.2021 | 11 | 11.3 | 10.7 |
| 20.02.2021 | 11.7 | 12.6 | 10.7 |
| 19.02.2021 | 12.1 | 12.9 | 11.6 |
| 18.02.2021 | 12.6 | 13.9 | 11.6 |
© Bayerisches Landesamt für Umwelt 2024