
- Start >
- Rivers >
- Discharge >
- Naab - Regen >
- Windischeschenbach >
- Chart of year

Chart of year Windischeschenbach / Waldnaab
Discharge from 10.08.2020 to 09.08.2021
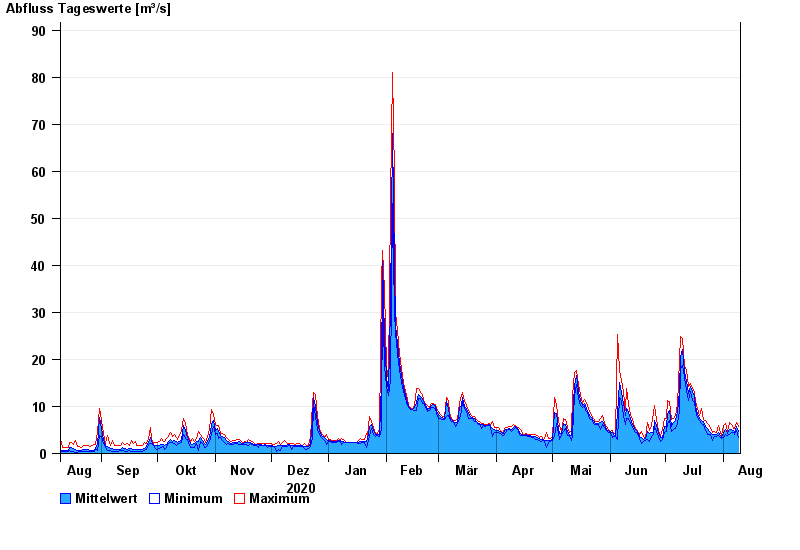
| Date | Mean value [m³/s] | Maximum [m³/s] | Minimum [m³/s] |
|---|---|---|---|
| 09.08.2021 | 4.65 | 5.64 | 3.49 |
| 08.08.2021 | 5.74 | 6.67 | 4.94 |
| 07.08.2021 | 4.57 | 5.4 | 4.08 |
| 06.08.2021 | 4.95 | 5.4 | 4.5 |
| 05.08.2021 | 5.15 | 6.15 | 4.5 |
| 04.08.2021 | 5.02 | 6.67 | 4.08 |
| 03.08.2021 | 4.25 | 4.72 | 3.88 |
© Bayerisches Landesamt für Umwelt 2024