
- Start >
- Rivers >
- Discharge >
- Naab - Regen >
- Windischeschenbach >
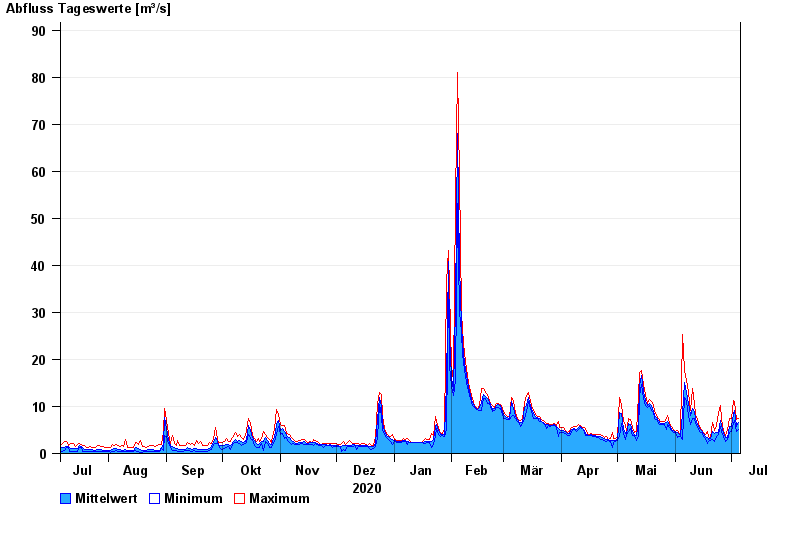
- Chart of year

Chart of year Windischeschenbach / Waldnaab
Discharge from 06.07.2020 to 05.07.2021
| Date | Mean value [m³/s] | Maximum [m³/s] | Minimum [m³/s] |
|---|---|---|---|
| 05.07.2021 | 6.69 | 7.49 | 5.18 |
| 04.07.2021 | 5.73 | 7.22 | 4.72 |
| 03.07.2021 | 9.08 | 11 | 6.95 |
| 02.07.2021 | 8.35 | 11.3 | 6.41 |
| 01.07.2021 | 5.77 | 7.49 | 4.73 |
| 30.06.2021 | 5.78 | 7.49 | 4.51 |
| 29.06.2021 | 3.44 | 5.18 | 2.97 |
© Bayerisches Landesamt für Umwelt 2024