
- Start >
- Rivers >
- Discharge >
- Naab - Regen >
- Windischeschenbach >
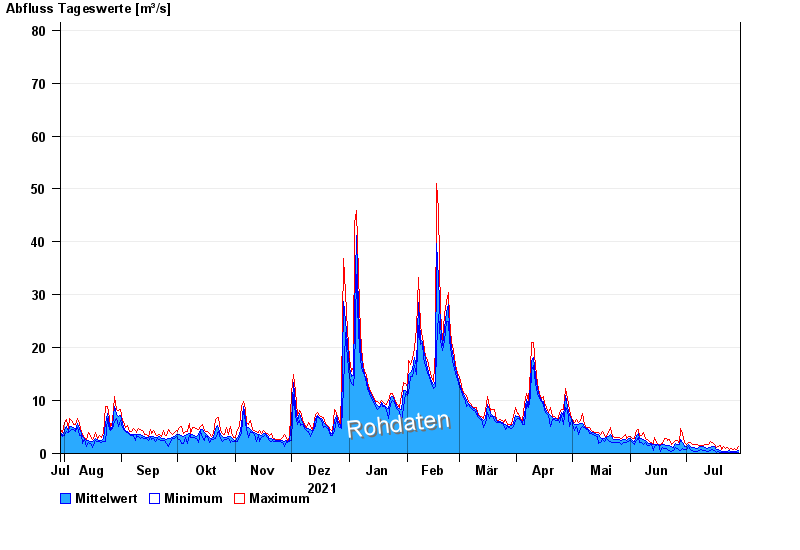
- Chart of year

Chart of year Windischeschenbach / Waldnaab
Discharge from 30.07.2021 to 29.07.2022
- 30.12.1986 Abfluss: 153 m³/s
- 26.01.1995 Abfluss: 144 m³/s
- 14.01.2011 Abfluss: 129 m³/s
- 28.01.2002 Abfluss: 124 m³/s
- 06.02.1980 Abfluss: 120 m³/s
| Date | Mean value [m³/s] | Maximum [m³/s] | Minimum [m³/s] |
|---|---|---|---|
| 29.07.2022 | 0.492 | 1.24 | 0.164 |
| 28.07.2022 | 0.438 | 0.799 | 0.144 |
| 27.07.2022 | 0.421 | 0.88 | 0.209 |
| 26.07.2022 | 0.414 | 0.799 | 0.236 |
| 25.07.2022 | 0.418 | 0.88 | 0.164 |
| 24.07.2022 | 0.48 | 0.728 | 0.144 |
| 23.07.2022 | 0.46 | 1.05 | 0.236 |
© Bayerisches Landesamt für Umwelt 2024