
- Start >
- Rivers >
- Discharge >
- Naab - Regen >
- Windischeschenbach >
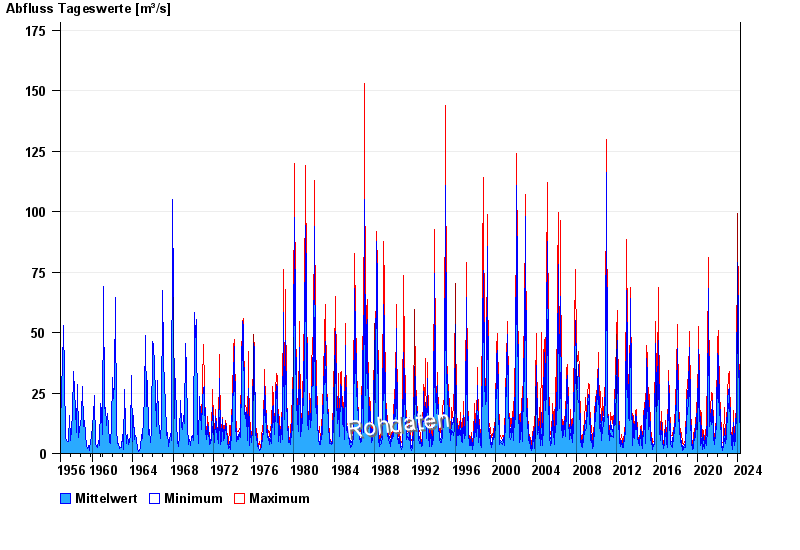
- Chart of total period

Chart of total period Windischeschenbach / Waldnaab
Discharge from 01.11.1956 to 20.04.2024
| Date | Mean value [m³/s] | Maximum [m³/s] | Minimum [m³/s] |
|---|---|---|---|
| 20.04.2024 | 7.82 | 7.82 | 7.82 |
| 19.04.2024 | 5.29 | 7.54 | 3.52 |
| 18.04.2024 | 5.5 | 6.72 | 4.55 |
| 17.04.2024 | 6.53 | 7.82 | 5.22 |
| 16.04.2024 | 4.45 | 5.46 | 3.52 |
| 15.04.2024 | 4.08 | 4.99 | 3.71 |
| 14.04.2024 | 4.12 | 4.33 | 3.92 |
© Bayerisches Landesamt für Umwelt 2024