
- Start >
- Rivers >
- Discharge >
- Naab - Regen >
- Wildenau >
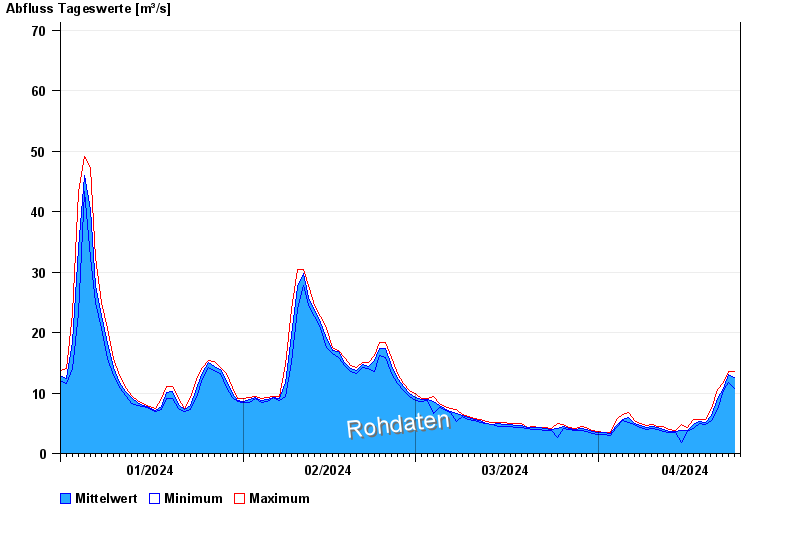
- Chart of year

Chart of year Wildenau / Haidenaab
Discharge from 01.01.2024 to 24.04.2024
- 12.07.1954 Abfluss: 118 m³/s
- 07.02.1945 Abfluss: 102 m³/s
- 22.03.1942 Abfluss: 96,5 m³/s
- 24.02.1970 Abfluss: 95,8 m³/s
- 15.01.2011 Abfluss: 94,7 m³/s
| Date | Mean value [m³/s] | Maximum [m³/s] | Minimum [m³/s] |
|---|---|---|---|
| 24.04.2024 | 13.5 | 13.5 | 13.5 |
| 23.04.2024 | 13 | 13.5 | 11.7 |
| 22.04.2024 | 10.8 | 11.7 | 10.4 |
| 21.04.2024 | 9.11 | 10.6 | 7.32 |
| 20.04.2024 | 6.27 | 7.52 | 5.38 |
| 19.04.2024 | 5.08 | 5.57 | 4.83 |
| 18.04.2024 | 5.24 | 5.57 | 5.01 |
© Bayerisches Landesamt für Umwelt 2024