
- Start >
- Rivers >
- Discharge >
- Naab - Regen >
- Warnbach >
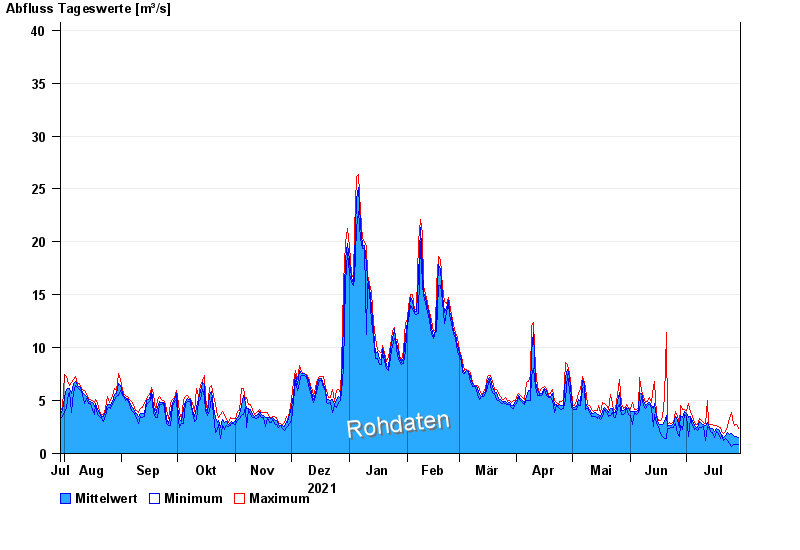
- Chart of year

Chart of year Warnbach / Schwarzach
Discharge from 30.07.2021 to 29.07.2022
- 09.07.1954 Abfluss: 145 m³/s
- 29.12.1947 Abfluss: 132 m³/s
- 23.02.1970 Abfluss: 125 m³/s
- 12.07.1948 Abfluss: 117 m³/s
- 15.03.1947 Abfluss: 112 m³/s
| Date | Mean value [m³/s] | Maximum [m³/s] | Minimum [m³/s] |
|---|---|---|---|
| 29.07.2022 | 1.52 | 2.35 | 0.829 |
| 28.07.2022 | 1.64 | 2.75 | 0.829 |
| 27.07.2022 | 1.65 | 2.64 | 0.829 |
| 26.07.2022 | 1.74 | 2.86 | 0.885 |
| 25.07.2022 | 1.9 | 3.84 | 0.627 |
| 24.07.2022 | 1.79 | 3.29 | 0.942 |
| 23.07.2022 | 2 | 2.54 | 1.26 |
© Bayerisches Landesamt für Umwelt 2024