
- Start >
- Rivers >
- Discharge >
- Naab - Regen >
- Warnbach >
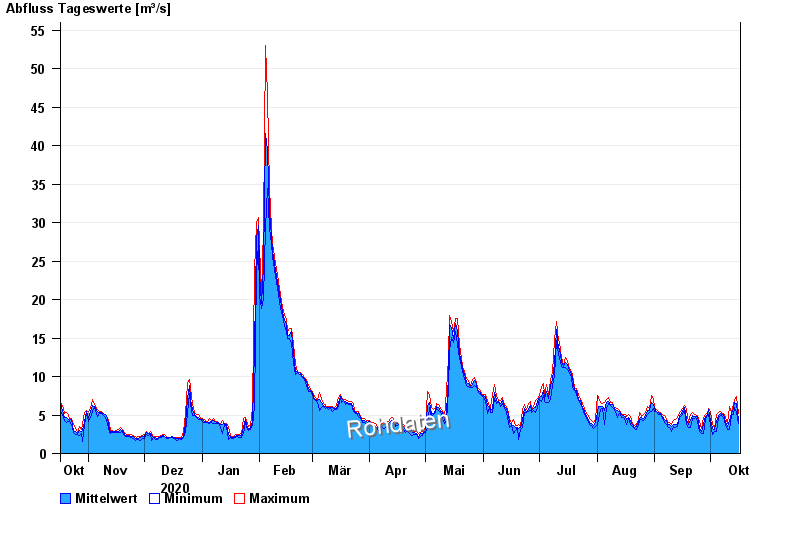
- Chart of year

Chart of year Warnbach / Schwarzach
Discharge from 17.10.2020 to 16.10.2021
| Date | Mean value [m³/s] | Maximum [m³/s] | Minimum [m³/s] |
|---|---|---|---|
| 16.10.2021 | 4.27 | 5.25 | 3.94 |
| 15.10.2021 | 6.56 | 7.36 | 5.36 |
| 14.10.2021 | 6.69 | 6.91 | 6.02 |
| 13.10.2021 | 5.88 | 6.46 | 5.13 |
| 12.10.2021 | 5.17 | 5.36 | 4.92 |
| 11.10.2021 | 4.34 | 6.13 | 3.18 |
| 10.10.2021 | 3.45 | 3.93 | 3.07 |
© Bayerisches Landesamt für Umwelt 2024