
- Start >
- Rivers >
- Discharge >
- Naab - Regen >
- Warnbach >
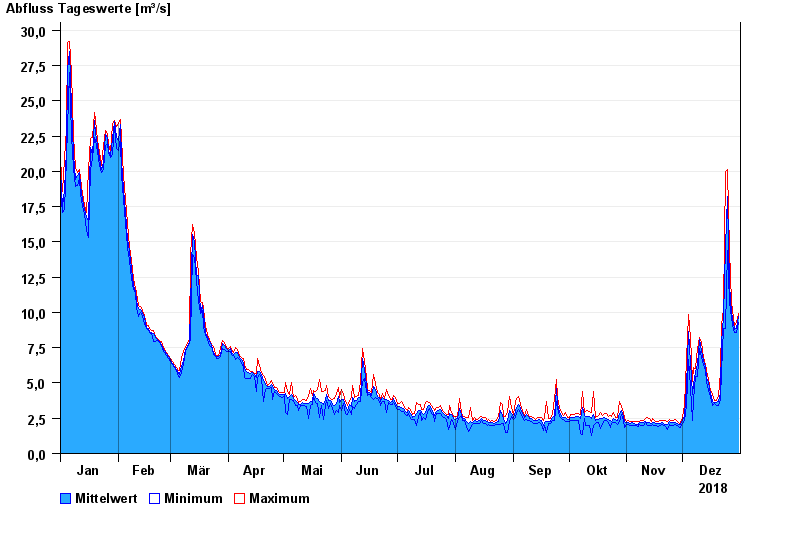
- Chart of year

Chart of year Warnbach / Schwarzach
Discharge from 01.01.2018 to 31.12.2018
| Date | Mean value [m³/s] | Maximum [m³/s] | Minimum [m³/s] |
|---|---|---|---|
| 31.12.2018 | 9.72 | 9.94 | 9.25 |
| 30.12.2018 | 8.85 | 9.25 | 8.56 |
| 29.12.2018 | 8.77 | 9.01 | 8.56 |
| 28.12.2018 | 9.21 | 9.57 | 8.78 |
| 27.12.2018 | 10 | 10.7 | 9.57 |
| 26.12.2018 | 11.9 | 14.4 | 10.7 |
| 25.12.2018 | 18.2 | 20.1 | 14.4 |
© Bayerisches Landesamt für Umwelt 2024