
- Start >
- Rivers >
- Discharge >
- Naab - Regen >
- Warnbach >
- Chart of year

Chart of year Warnbach / Schwarzach
Discharge from 01.01.2024 to 18.04.2024
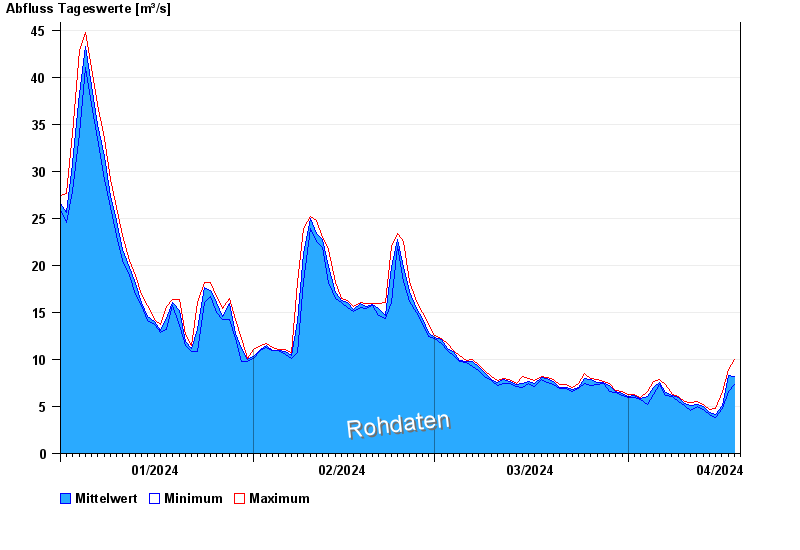
| Date | Mean value [m³/s] | Maximum [m³/s] | Minimum [m³/s] |
|---|---|---|---|
| 18.04.2024 | 7.83 | 7.97 | 7.76 |
| 17.04.2024 | 8.34 | 8.88 | 6.63 |
| 16.04.2024 | 5.12 | 6.63 | 4.76 |
| 15.04.2024 | 4.12 | 4.76 | 3.78 |
| 14.04.2024 | 4.35 | 4.65 | 4.1 |
| 13.04.2024 | 5.03 | 5.2 | 4.65 |
| 12.04.2024 | 5.19 | 5.53 | 4.98 |
© Bayerisches Landesamt für Umwelt 2024