
- Start >
- Rivers >
- Discharge >
- Naab - Regen >
- Warnbach >
- Chart of year

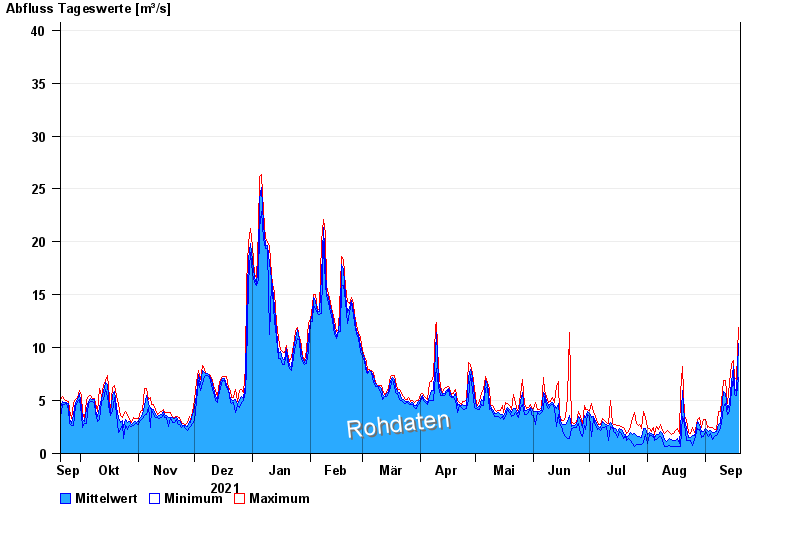
Chart of year Warnbach / Schwarzach
Discharge from 20.09.2021 to 19.09.2022
- 09.07.1954 Abfluss: 145 m³/s
- 29.12.1947 Abfluss: 132 m³/s
- 23.02.1970 Abfluss: 125 m³/s
- 12.07.1948 Abfluss: 117 m³/s
- 15.03.1947 Abfluss: 112 m³/s
| Date | Mean value [m³/s] | Maximum [m³/s] | Minimum [m³/s] |
|---|---|---|---|
| 19.09.2022 | 10.4 | 11.9 | 7.14 |
| 18.09.2022 | 5.73 | 7.03 | 5.49 |
| 17.09.2022 | 6.14 | 7.14 | 5.6 |
| 16.09.2022 | 8.2 | 8.8 | 7.14 |
| 15.09.2022 | 6.77 | 8.38 | 5.92 |
| 14.09.2022 | 4.75 | 6.7 | 3.94 |
| 13.09.2022 | 4.15 | 4.71 | 3.72 |
© Bayerisches Landesamt für Umwelt 2024