
- Start >
- Rivers >
- Discharge >
- Naab - Regen >
- Unterbruck Flutmulde >
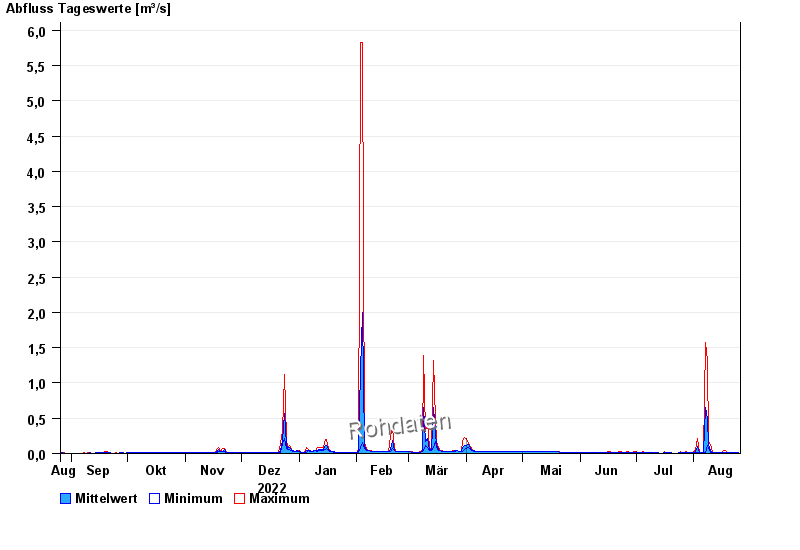
- Chart of year

Chart of year Unterbruck Flutmulde / Haidenaab
Discharge from 26.08.2022 to 25.08.2023
| Date | Mean value [m³/s] | Maximum [m³/s] | Minimum [m³/s] |
|---|---|---|---|
| 25.08.2023 | 0.021 | 0.021 | 0.021 |
| 24.08.2023 | 0.017 | 0.021 | 0.011 |
| 23.08.2023 | 0.011 | 0.012 | 0.011 |
| 22.08.2023 | 0.012 | 0.012 | 0.011 |
| 21.08.2023 | 0.012 | 0.012 | 0.012 |
| 20.08.2023 | 0.012 | 0.012 | 0.012 |
| 19.08.2023 | 0.012 | 0.012 | 0.012 |
© Bayerisches Landesamt für Umwelt 2024